
 Yahoo Finance
 Boasting A 26% Return On Equity, Is American Tower Corporation (NYSE:AMT) A Top Quality Stock?
Many investors are still learning about the various metrics that can be useful when analysing a stock. This article is for those who would like to learn about Return On Equity (ROE). We'll use ROE to examine American Tower Corporation (NYSE:AMT), by way of a worked example.
Return on Equity or ROE is a test of how effectively a company is growing its value and managing investors’ money. Put another way, it reveals the company's success at turning shareholder investments into profits.
View our latest analysis for American Tower
How Do You Calculate Return On Equity?
The formula for ROE is:
Return on Equity = Net Profit (from continuing operations) ÷ Shareholders' Equity
So, based on the above formula, the ROE for American Tower is:
26% = US$2.8b ÷ US$11b (Based on the trailing twelve months to June 2022).
The 'return' is the income the business earned over the last year. That means that for every $1 worth of shareholders' equity, the company generated $0.26 in profit.
Does American Tower Have A Good Return On Equity?
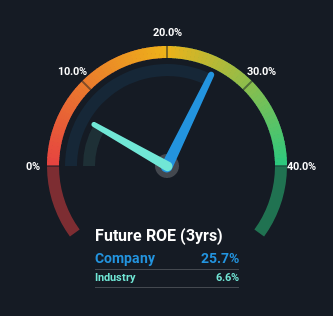
Arguably the easiest way to assess company's ROE is to compare it with the average in its industry. However, this method is only useful as a rough check, because companies do differ quite a bit within the same industry classification. As is clear from the image below, American Tower has a better ROE than the average (6.6%) in the REITs industry.
That is a good sign. With that said, a high ROE doesn't always indicate high profitability. Aside from changes in net income, a high ROE can also be the outcome of high debt relative to equity, which indicates risk. To know the 2 risks we have identified for American Tower visit our risks dashboard for free.
How Does Debt Impact ROE?
Most companies need money -- from somewhere -- to grow their profits. The cash for investment can come from prior year profits (retained earnings), issuing new shares, or borrowing. In the case of the first and second options, the ROE will reflect this use of cash, for growth. In the latter case, the debt used for growth will improve returns, but won't affect the total equity. In this manner the use of debt will boost ROE, even though the core economics of the business stay the same.
Combining American Tower's Debt And Its 26% Return On Equity
It appears that American Tower makes extensive use of debt to improve its returns, because it has an alarmingly high debt to equity ratio of 3.81. So although the company has an impressive ROE, the company might not have been able to achieve this without the significant use of debt.
Summary
Return on equity is a useful indicator of the ability of a business to generate profits and return them to shareholders. In our books, the highest quality companies have high return on equity, despite low debt. If two companies have the same ROE, then I would generally prefer the one with less debt.
But when a business is high quality, the market often bids it up to a price that reflects this. It is important to consider other factors, such as future profit growth -- and how much investment is required going forward. So you might want to take a peek at this data-rich interactive graph of forecasts for the company.
Of course, you might find a fantastic investment by looking elsewhere. So take a peek at this free list of interesting companies.
Have feedback on this article? Concerned about the content? Get in touch with us directly. Alternatively, email editorial-team (at) simplywallst.com.
This article by Simply Wall St is general in nature. We provide commentary based on historical data and analyst forecasts only using an unbiased methodology and our articles are not intended to be financial advice. It does not constitute a recommendation to buy or sell any stock, and does not take account of your objectives, or your financial situation. We aim to bring you long-term focused analysis driven by fundamental data. Note that our analysis may not factor in the latest price-sensitive company announcements or qualitative material. Simply Wall St has no position in any stocks mentioned.
Join A Paid User Research Session
You’ll receive a US$30 Amazon Gift card for 1 hour of your time while helping us build better investing tools for the individual investors like yourself. Sign up here
