
 Yahoo Finance
 BlackRock Inc's Dividend Analysis
Insights into BlackRock Inc's Upcoming Dividend Payout
BlackRock Inc (NYSE:BLK) recently announced a dividend of $5 per share, payable on 2023-12-22, with the ex-dividend date set for 2023-12-06. As investors look forward to this upcoming payment, the spotlight also shines on the company's dividend history, yield, and growth rates. Using the data from GuruFocus, let's look into BlackRock Inc's dividend performance and assess its sustainability.
What Does BlackRock Inc Do?
This Powerful Chart Made Peter Lynch 29% A Year For 13 Years
How to calculate the intrinsic value of a stock?
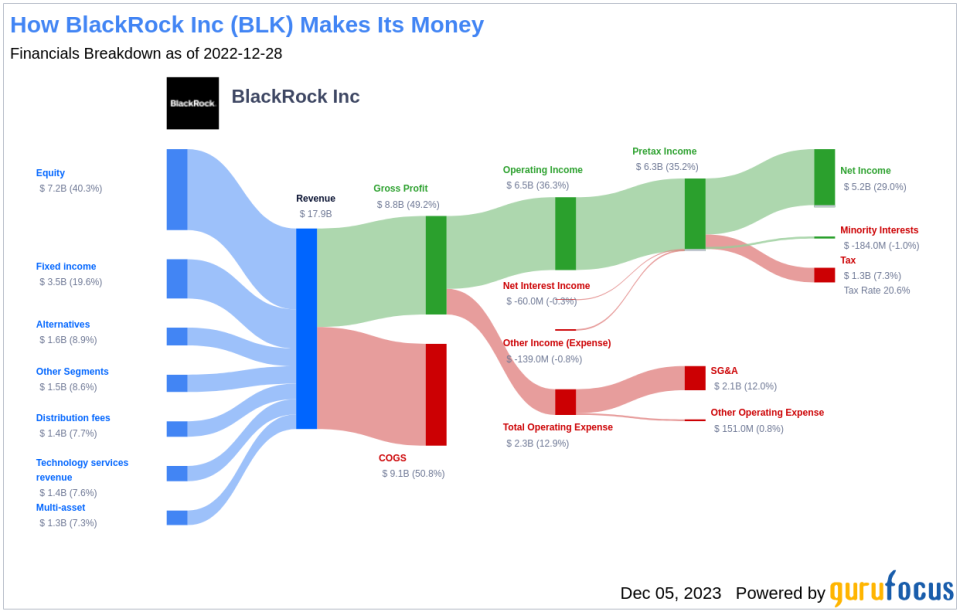
BlackRock is the largest asset manager in the world, with $9.101 trillion in AUM at the end of September 2023. Product mix is fairly diverse, with 52% of the firm's managed assets in equity strategies, 28% in fixed income, 9% in multi-asset class, 8% in money market funds, and 3% in alternatives. Passive strategies account for around two thirds of long-term AUM, with the company's ETF platform maintaining a leading market share domestically and on a global basis. Product distribution is weighted more toward institutional clients, which by our calculations account for around 80% of AUM. BlackRock is also geographically diverse, with clients in more than 100 countries and more than one third of managed assets coming from investors domiciled outside the U.S. and Canada.
A Glimpse at BlackRock Inc's Dividend History
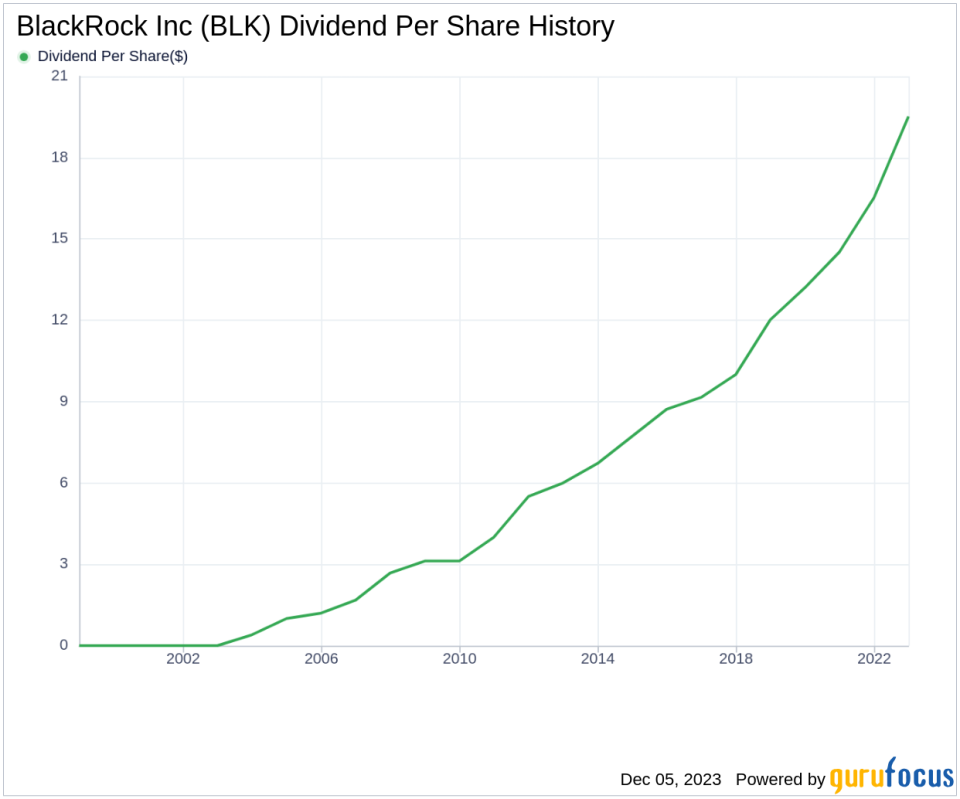
BlackRock Inc has maintained a consistent dividend payment record since 2003. Dividends are currently distributed on a quarterly basis.
BlackRock Inc has increased its dividend each year since 2003. The stock is thus listed as a dividend achiever, an honor that is given to companies that have increased their dividend each year for at least the past 20 years. Below is a chart showing annual Dividends Per Share for tracking historical trends.
Breaking Down BlackRock Inc's Dividend Yield and Growth
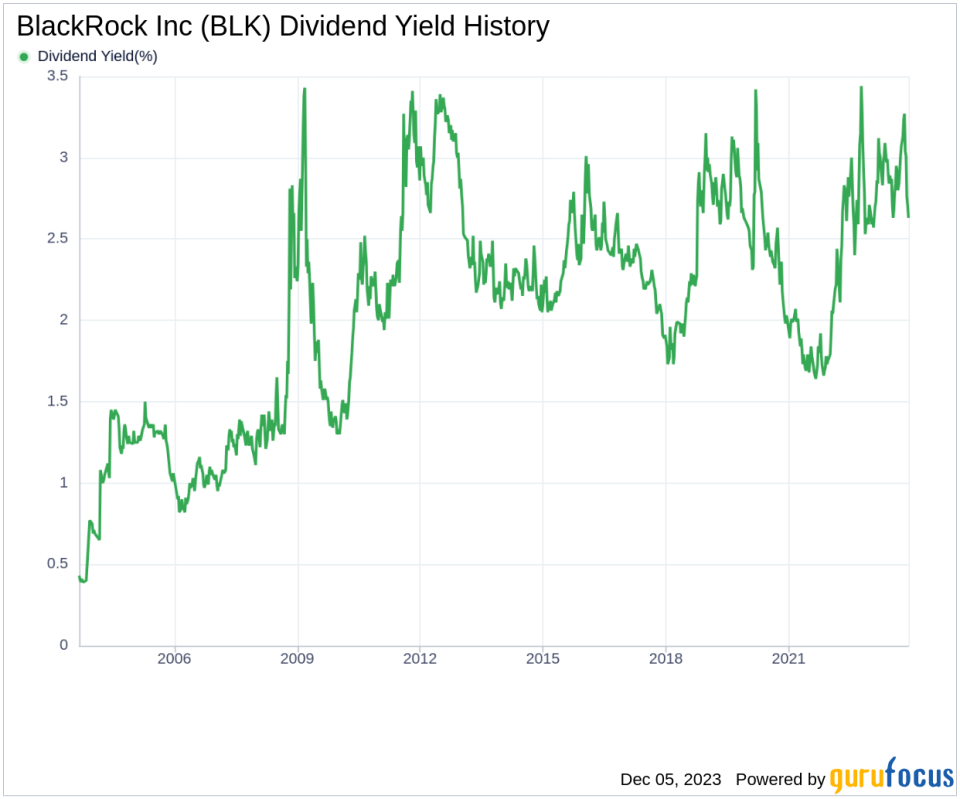
As of today, BlackRock Inc currently has a 12-month trailing dividend yield of 2.65% and a 12-month forward dividend yield of 2.67%. This suggests an expectation of increased dividend payments over the next 12 months.
Over the past three years, BlackRock Inc's annual dividend growth rate was 13.90%. Extended to a five-year horizon, this rate decreased to 13.40% per year. And over the past decade, BlackRock Inc's annual dividends per share growth rate stands at an impressive 12.00%.
Based on BlackRock Inc's dividend yield and five-year growth rate, the 5-year yield on cost of BlackRock Inc stock as of today is approximately 4.97%.
The Sustainability Question: Payout Ratio and Profitability
To assess the sustainability of the dividend, one needs to evaluate the company's payout ratio. The dividend payout ratio provides insights into the portion of earnings the company distributes as dividends. A lower ratio suggests that the company retains a significant part of its earnings, thereby ensuring the availability of funds for future growth and unexpected downturns. As of 2023-09-30, BlackRock Inc's dividend payout ratio is 0.85, which may suggest that the company's dividend may not be sustainable.
BlackRock Inc's profitability rank, offers an understanding of the company's earnings prowess relative to its peers. GuruFocus ranks BlackRock Inc's profitability 9 out of 10 as of 2023-09-30, suggesting good profitability prospects. The company has reported positive net income for each of year over the past decade, further solidifying its high profitability.
Growth Metrics: The Future Outlook
To ensure the sustainability of dividends, a company must have robust growth metrics. BlackRock Inc's growth rank of 9 out of 10 suggests that the company's growth trajectory is good relative to its competitors.
Revenue is the lifeblood of any company, and BlackRock Inc's revenue per share, combined with the 3-year revenue growth rate, indicates a strong revenue model. BlackRock Inc's revenue has increased by approximately 8.40% per year on average, a rate that outperforms approximately 54.68% of global competitors.
The company's 3-year EPS growth rate showcases its capability to grow its earnings, a critical component for sustaining dividends in the long run. During the past three years, BlackRock Inc's earnings increased by approximately 7.60% per year on average, a rate that outperforms approximately 49.14% of global competitors.
Lastly, the company's 5-year EBITDA growth rate of 11.10%, which outperforms approximately 60.67% of global competitors, suggests that its profitability is not only current but also has the potential to increase over time.
Concluding Thoughts on BlackRock Inc's Dividend Profile
Considering BlackRock Inc's consistent history of dividend payments, robust dividend growth rate, and a payout ratio that, while on the higher end, is backed by a strong profitability rank, investors may find reassurance in the company's ability to maintain its dividends. The growth metrics further bolster the case for sustainability, painting a picture of a company well-positioned to continue rewarding its shareholders. As value investors consider the future prospects of BlackRock Inc, they may find the company's dividend policy to be a compelling aspect of its overall investment thesis.
GuruFocus Premium users can screen for high-dividend yield stocks using the High Dividend Yield Screener.
This article, generated by GuruFocus, is designed to provide general insights and is not tailored financial advice. Our commentary is rooted in historical data and analyst projections, utilizing an impartial methodology, and is not intended to serve as specific investment guidance. It does not formulate a recommendation to purchase or divest any stock and does not consider individual investment objectives or financial circumstances. Our objective is to deliver long-term, fundamental data-driven analysis. Be aware that our analysis might not incorporate the most recent, price-sensitive company announcements or qualitative information. GuruFocus holds no position in the stocks mentioned herein.
This article first appeared on GuruFocus.
