Bitcoin's 200-Day Average Is Approaching a Record High; Here's Why It Matters
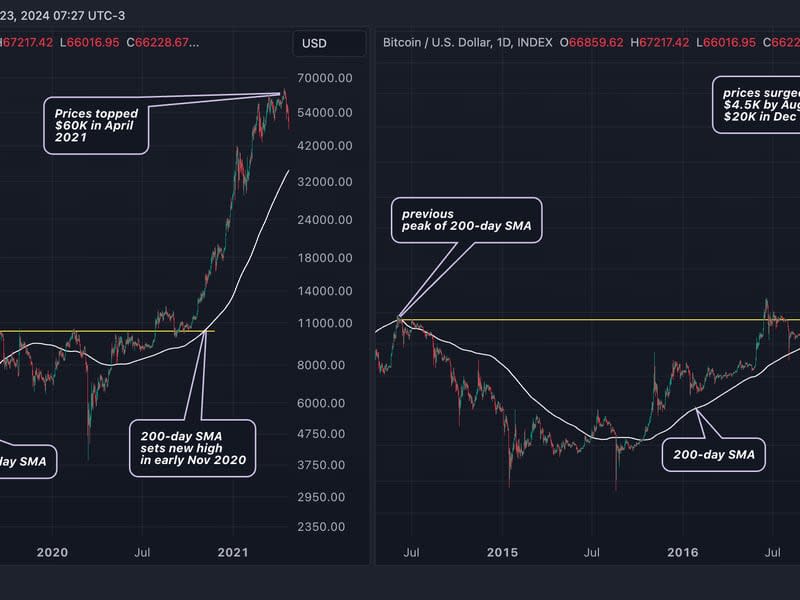
Bitcoin's 200-day average is on track to challenge its previous peak of $49,452 from February 2022.
Past data show the most intense phase of the bull cycle unfolds after this average surpasses its previous peak.
Bitcoin's {{BTC}} price moved into bullish territory above the 200-day simple moving average (SMA) in October, setting record highs above $73,000 last month.
Now, the average, a crucial barometer of long-term trends, is also rising fast in a sign of strong bullish momentum and appears set to surpass its previous peak of $49,452 in February 2022. At press time, bitcoin traded at $66,200, with the 200-day average at $47,909.
That's noteworthy for traders as past data show the most intense phase of the bullish cycle unfolds after the average surpasses its previous peak to new lifetime highs.
In early November 2020, six months after the third halving, bitcoin's 200-day SMA rose to its then-highest above $10,320. By mid-April 2021, bitcoin had rallied 4.5 times to $63,800.

The cryptocurrency surged over 2000% to nearly $20,000 in 12 months after the average set new highs in December 2016, or five months after the second halving. A similar meteoric rally unfolded after the average rose to a new peak in November 2012, around the time of the first halving.
As always, past data is no guarantee of future results.
That said, some features of the past cycles have been repeated to a T. For instance, BTC's bear market climaxed in November 2022, and prices rose in subsequent months, which aligns with the historical pattern of bottoming out to start a new rally 15 months ahead of the halving. Bitcoin blockchain implemented the fourth mining reward halving on Saturday, reducing the per-block coin emission to 3.125 BTC from 6.25 BTC.
Most analysts are of the view that rising government debt concerns will eventually force the U.S. Federal Reserve (Fed) to cut interest rates rapidly, keeping risk assets, including cryptocurrencies, in an uptrend.
In the short term, however, prices may drop due to profit-taking and volatility in bond markets.

 Yahoo Finance