
 Yahoo Finance
 Bitcoin and XRP – Temporary Price Recovery Coming?
Bitcoin price analysis
Bitcoin (BTC/USD) is consolidating above its key mid and long-term support levels. The current level has been successfully tested one time after the other, since November 2017. The leading cryptocurrency quarterly price average is about to cross its monthly price average from the upside towards the downside, suggesting a temporary price recovery.
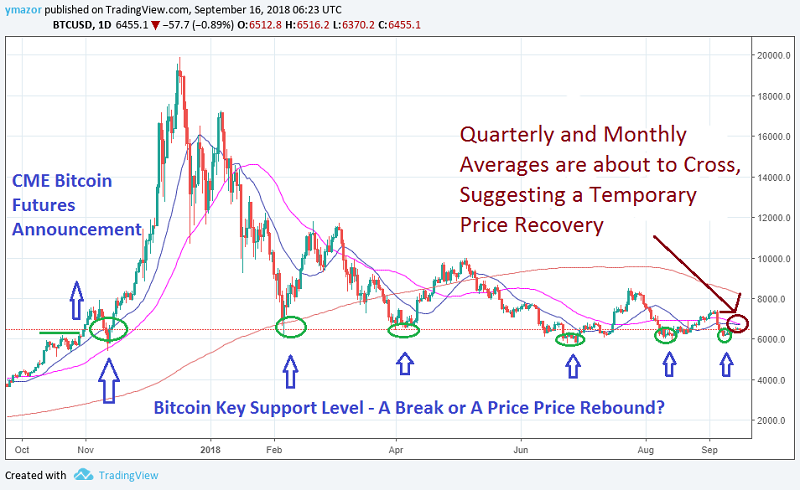
Support levels:
Week: 6,200 Strong: 6,000 Key: 5,800
Resistance levels:
Week: 6,600 Strong: 6,800 Key: 7,300
Average prices:
Month: 6,717 Quarter: 6,744 Year: 8,222
Bitcoin Cash price analysis
Bitcoin Cash (BCH/USD) has formed a strong price resistance level between 600 and 800 and keeps trading near year lows.

Support levels:
Week: 400.0 Strong: 350.0 Key: 280.0
Resistance levels:
Week: 460.0 Strong: 520.0 Key: 650.0
Average prices:
Month: 519.29 Quarter: 573.85 Year: 1028.80
Ethereum price analysis
Ethereum (ETH/USD) has formed a clear downward trend channel since May 2018 and has not been able to recover amid a lack of positive catalyst.
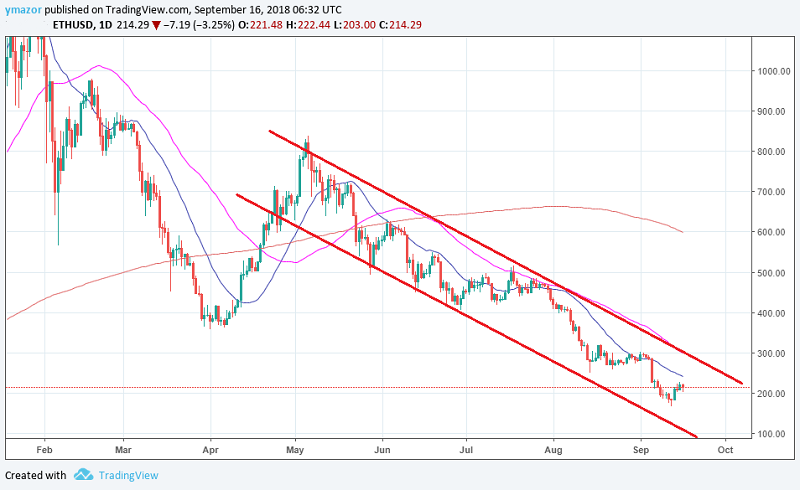
Support levels:
Week: 170.0 Strong: 136.0 Key: 100.0
Resistance levels:
Week: 210.0 Strong: 240.0 Key: 300.0
Average prices:
Month: 242.42 Quarter: 299.05 Year: 598.74
Litecoin price analysis
Litecoin (LTC/USD) is still battling to hold its temporary fragile short-term support around the 50 mark with no technical recovery signs.

Support levels:
Week: 45.00 Strong: 40.00 Key: 35.00
Resistance levels:
Week: 56.00 Strong: 64.00 Key: 70.00
Average prices:
Month: 58.68 Quarter: 61.81 Year: 126.94
XRP price analysis
XRP (XRP/USD) is steadily trading within a downward trend channel, however, it has been forming an inverted head and shoulder pattern that is cueing a possible price rebound.

Support levels:
Week: 0.246 Strong: 0.200 Key: 0.129
Resistance levels:
Week: 0.280 Strong: 0.310 Key: 0.360
Average prices:
Month: 0.304 Quarter: 0.334 Year: 0.693
*Any views and opinions presented in this section only reflect the author’s private opinion and should not be considered as guidance for trading.
This article was written by Yaron Mazor, a senior analyst at DX.Exchange
This article was originally posted on FX Empire
