
 Yahoo Finance
 Bijou Brigitte modische Accessoires (ETR:BIJ) shareholders have earned a 28% CAGR over the last three years
By buying an index fund, you can roughly match the market return with ease. But if you buy good businesses at attractive prices, your portfolio returns could exceed the average market return. Just take a look at Bijou Brigitte modische Accessoires Aktiengesellschaft (ETR:BIJ), which is up 91%, over three years, soundly beating the market decline of 11% (not including dividends). However, more recent returns haven't been as impressive as that, with the stock returning just 24% in the last year , including dividends .
So let's investigate and see if the longer term performance of the company has been in line with the underlying business' progress.
Check out our latest analysis for Bijou Brigitte modische Accessoires
In his essay The Superinvestors of Graham-and-Doddsville Warren Buffett described how share prices do not always rationally reflect the value of a business. One flawed but reasonable way to assess how sentiment around a company has changed is to compare the earnings per share (EPS) with the share price.
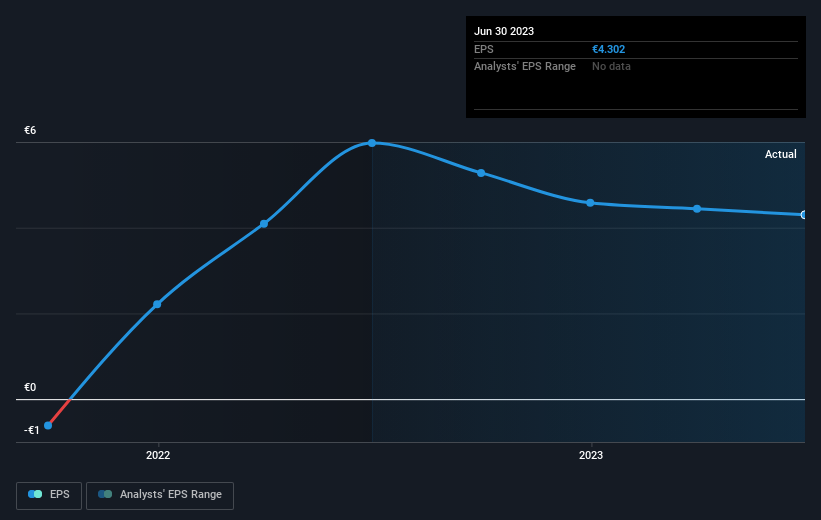
During three years of share price growth, Bijou Brigitte modische Accessoires moved from a loss to profitability. So we would expect a higher share price over the period.
You can see how EPS has changed over time in the image below (click on the chart to see the exact values).
Dive deeper into Bijou Brigitte modische Accessoires' key metrics by checking this interactive graph of Bijou Brigitte modische Accessoires's earnings, revenue and cash flow.
What About Dividends?
When looking at investment returns, it is important to consider the difference between total shareholder return (TSR) and share price return. The TSR is a return calculation that accounts for the value of cash dividends (assuming that any dividend received was reinvested) and the calculated value of any discounted capital raisings and spin-offs. Arguably, the TSR gives a more comprehensive picture of the return generated by a stock. As it happens, Bijou Brigitte modische Accessoires' TSR for the last 3 years was 111%, which exceeds the share price return mentioned earlier. The dividends paid by the company have thusly boosted the total shareholder return.
A Different Perspective
It's nice to see that Bijou Brigitte modische Accessoires shareholders have received a total shareholder return of 24% over the last year. Of course, that includes the dividend. That's better than the annualised return of 4% over half a decade, implying that the company is doing better recently. In the best case scenario, this may hint at some real business momentum, implying that now could be a great time to delve deeper. It's always interesting to track share price performance over the longer term. But to understand Bijou Brigitte modische Accessoires better, we need to consider many other factors. To that end, you should be aware of the 2 warning signs we've spotted with Bijou Brigitte modische Accessoires .
For those who like to find winning investments this free list of growing companies with recent insider purchasing, could be just the ticket.
Please note, the market returns quoted in this article reflect the market weighted average returns of stocks that currently trade on German exchanges.
Have feedback on this article? Concerned about the content? Get in touch with us directly. Alternatively, email editorial-team (at) simplywallst.com.
This article by Simply Wall St is general in nature. We provide commentary based on historical data and analyst forecasts only using an unbiased methodology and our articles are not intended to be financial advice. It does not constitute a recommendation to buy or sell any stock, and does not take account of your objectives, or your financial situation. We aim to bring you long-term focused analysis driven by fundamental data. Note that our analysis may not factor in the latest price-sensitive company announcements or qualitative material. Simply Wall St has no position in any stocks mentioned.
