
 Yahoo Finance
 The Best and Worst State Capitals To Live In

State capitals serve as cultural and political hubs for the states they represent, so moving to a state capital can come with a certain amount of bragging rights. Additionally, state capitals are often centrally located near sights and amenities worth visiting.
However, every state has its own issues to consider, positive and negative, and their capitals are no exception. It's important to understand some key demographics when considering a move to a state capital, as well as determining whether living in a state capital means a higher quality of life. To assess which state capitals are the best, and the worst, to live in, GOBankingRates analyzed all 50 state capitals by a set of criteria including such details as crime rates, cost of living, median household income, unemployment rate and the percent of people living below the poverty line.
See: These Are the 10 Most Overpriced Housing Markets in the US -- 5 Are in Florida
Read More: 3 Things You Must Do When Your Savings Reach $50,000
These rankings might prove helpful in your search for the right place to live.
Best State Capitals
The best state capitals all share a few characteristics, including a solid median household income, low poverty and unemployment rates, a low cost of necessities, affordable homes and a good grade for school districts.
Read: 7 Florida Cities That Could Be Headed for a Housing Crisis
Next: 10 US Cities With Plenty of Jobs and Cheap Housing

25. Tallahassee, Florida
Tallahassee has one of the highest poverty rates of all state capitals, with more than a quarter of the population living below the poverty line. It also suffers from a low household median income of $45,734, though Florida residents can keep more of that money because there's no state income tax. On the bright side, Tallahassee's school district received a grade of B+.
Take Our Poll: Are You Planning To Buy or Sell a House This Year?
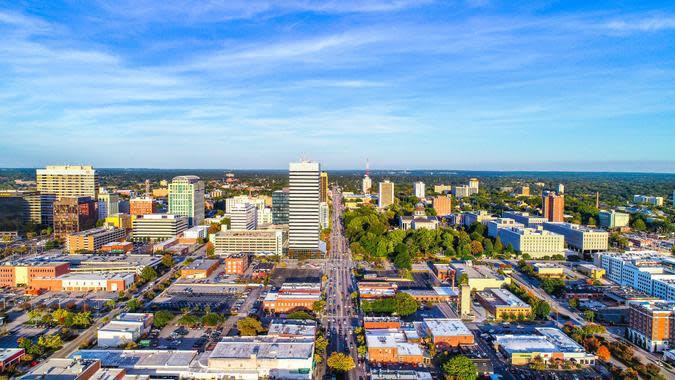
24. Columbia, South Carolina
January 2023 unemployment rate: 2.70%
% of people below poverty line: 24.3
2023 home value: $262,963
Non-housing expenditures: $20,271.42

23. Springfield, Illinois
January 2023 unemployment rate: 4.30%
% of people below poverty line: 17.6
2023 home value: $136,430
Non-housing expenditures: $19,134.74

22. Oklahoma City
January 2023 unemployment rate: 3.00%
% of people below poverty line: 14.9
2023 home value: $195,204
Non-housing expenditures: $20,297.14

21. Charleston, West Virginia
January 2023 unemployment rate: 2.90%
% of people below poverty line: 17.5
2023 home value: $152,865
Non-housing expenditures: $21,234.37
Mortgage Interest Rate Forecast for 2023: When Will Rates Go Down?
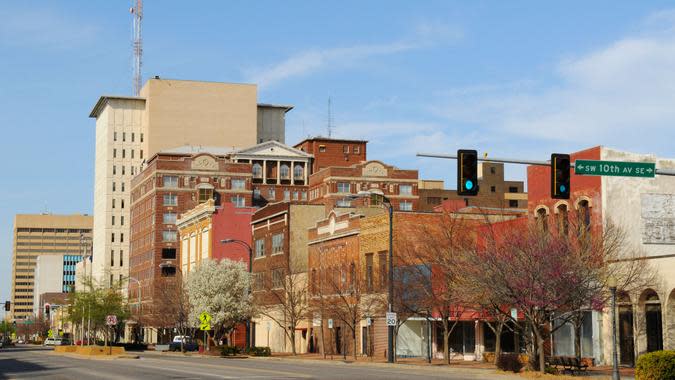
20. Topeka, Kansas
January 2023 unemployment rate: 3.10%
% of people below poverty line: 15.2
2023 home value: $169,832
Non-housing expenditures: $19,363.30

19. Olympia, Washington
January 2023 unemployment rate: 3.10%
% of people below poverty line: 15.2
2023 home value: $169,832
Non-housing expenditures: $19,363.30

18. Saint Paul, Minnesota
January 2023 unemployment rate: 5.20%
% of people below poverty line: 14.0
2023 home value: $500,131
Non-housing expenditures: $18,399.53

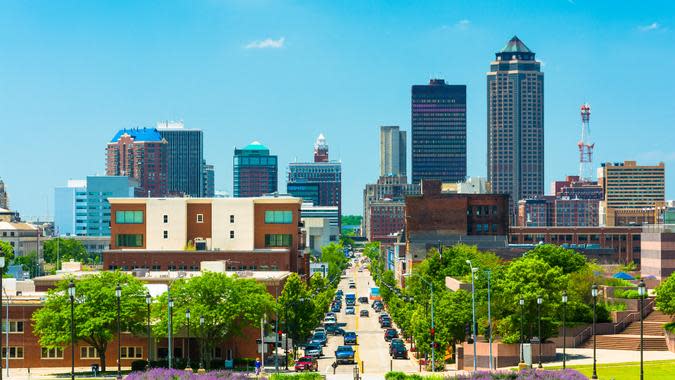
17. Des Moines, Iowa
January 2023 unemployment rate: 3.30%
% of people below poverty line: 15.3
2023 home value: $190,118
Non-housing expenditures: $18,659.75
Housing Market 2023: Prices Are Now So High That Banks Are Losing Money on Mortgages
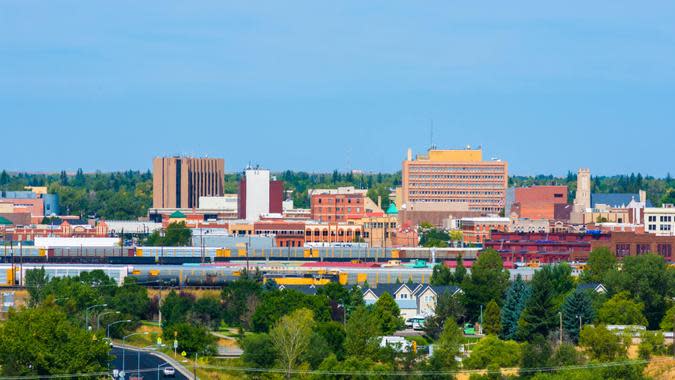
16. Cheyenne, Wyoming
January 2023 unemployment rate: 3.30%
% of people below poverty line: 15.3
2023 home value: $190,118
Non-housing expenditures: $18,659.75
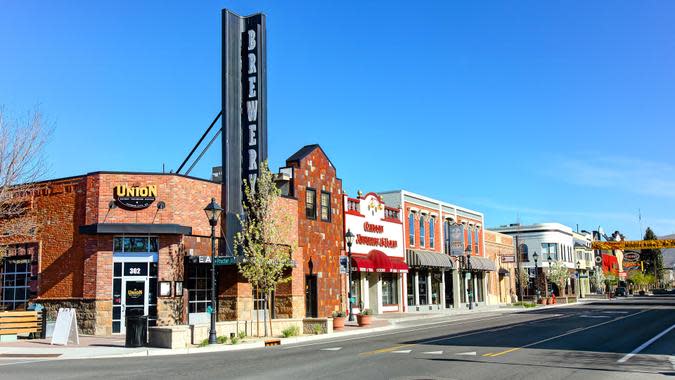
15. Carson City, Nevada
January 2023 unemployment rate: 5.20%
% of people below poverty line: 10.0
2023 home value: $448,604
Non-housing expenditures: $20,080.08

14. Juneau, Alaska
January 2023 unemployment rate: 3.80%
% of people below poverty line: 7.2
2023 home value: $459,845
Non-housing expenditures: $21,561.93

13. Austin, Texas
January 2023 unemployment rate: 3.00%
% of people below poverty line: 12.5
2023 home value: $565,992
Non-housing expenditures: $21,054.20
Find Out: 7 States Considering More Stimulus Checks in 2023
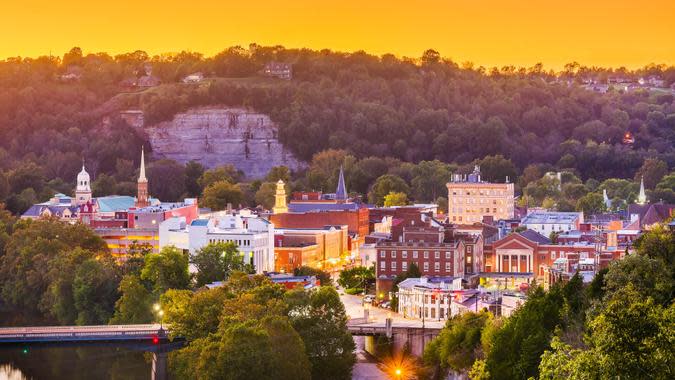
12. Frankfort, Kentucky
January 2023 unemployment rate: 3.00%
% of people below poverty line: 16.3
2023 home value: $197,118
Non-housing expenditures: $18,271.19

11. Helena, Montana
January 2023 unemployment rate: 2.60%
% of people below poverty line: 9.4
2023 home value: $424,724
Non-housing expenditures: $18,018.72

10. Raleigh, North Carolina
January 2023 unemployment rate: 3.10%
% of people below poverty line: 12.1
2023 home value: $419,586
Non-housing expenditures: $19,678.30

9. Jefferson City, Missouri
January 2023 unemployment rate: 2.40%
% of people below poverty line: 12.6
2023 home value: $224,379
Non-housing expenditures: $19,908.67
Stimulus 2023: Updates To Know Now
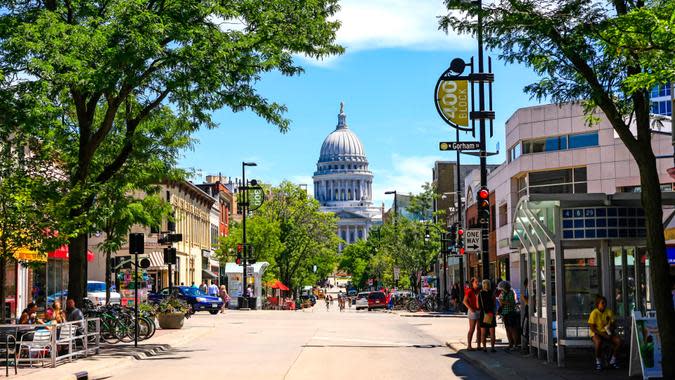
8. Madison, Wisconsin
January 2023 unemployment rate: 2.00%
% of people below poverty line: 16.6
2023 home value: $370,096
Non-housing expenditures: $19,365.40
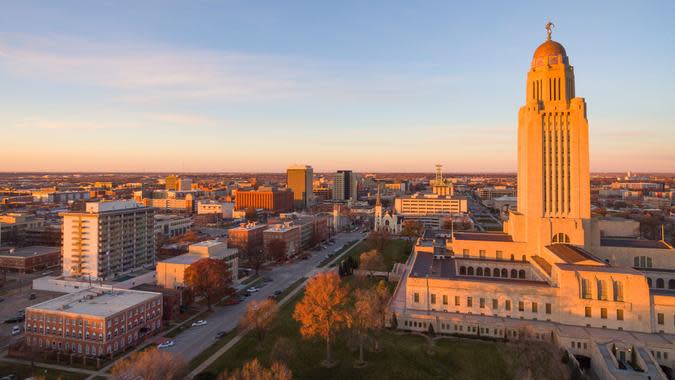
7. Lincoln, Nebraska
January 2023 unemployment rate: 2.00%
% of people below poverty line: 13.0
2023 home value: $263,302
Non-housing expenditures: $20,665.90
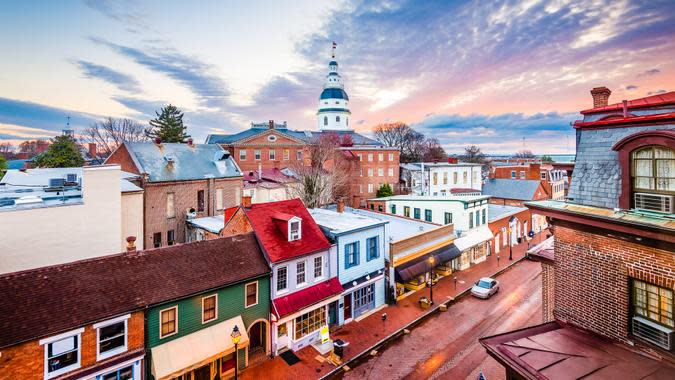
6. Annapolis, Maryland
January 2023 unemployment rate: 2.00%
% of people below poverty line: 13.0
2023 home value: $263,302
Non-housing expenditures: $20,665.90

5. Boise, Idaho
January 2023 unemployment rate: 2.80%
% of people below poverty line: 11.6
2023 home value: $469,840
Non-housing expenditures: $19,003.29
Find Out: 8 Places in California Where Home Prices Have Plummeted
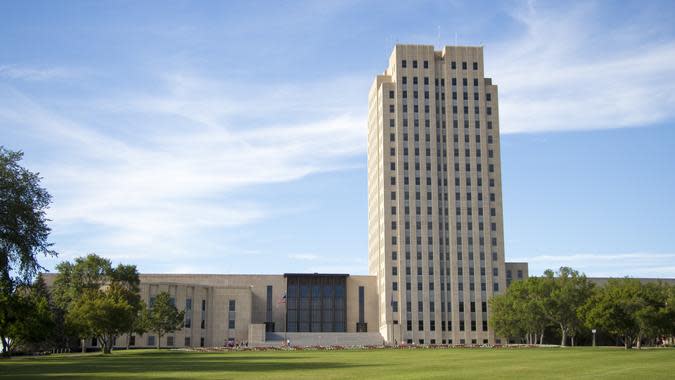
4. Bismarck, North Dakota
January 2023 unemployment rate: 2.70%
% of people below poverty line: 8.7
2023 home value: $333,220
Non-housing expenditures: $18,395.13
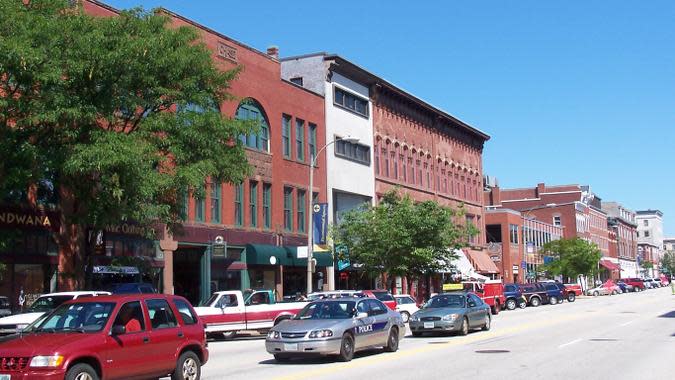
3. Concord, New Hampshire
January 2023 unemployment rate: 2.70%
% of people below poverty line: 9.3
2023 home value: $364,129
Non-housing expenditures: $19,136.10
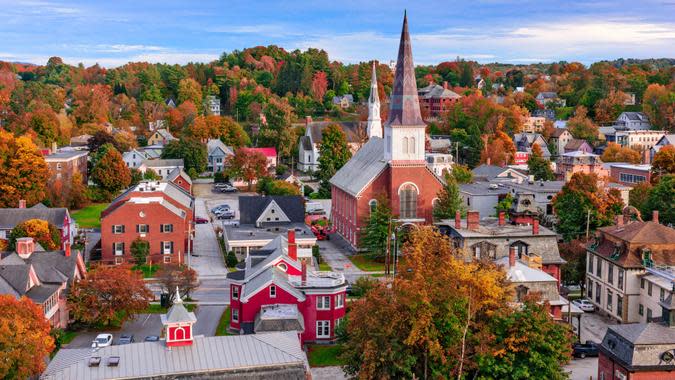
2. Montpelier, Vermont
January 2023 unemployment rate: 2.80%
% of people below poverty line: 4.9
2023 home value: $358,723
Non-housing expenditures: $21,459.91

1. Pierre, South Dakota
January 2023 unemployment rate: 1.60%
% of people below poverty line: 15.9
2023 home value: $271,762
Non-housing expenditures: $19,122.77
I'm a Self-Made Millionaire: These Are the 6 Investments Everyone Should Make During an Economic Downturn

Worst State Capitals
The worst state capitals usually feature low household income, high poverty and unemployment rates and high crime rates. They might also have expensive necessities and housing costs or poor school district grades. These factors become more extreme the lower a capital is in the rankings.

25. Indianapolis
January 2023 unemployment rate: 2.80%
% of people below poverty line: 21.2
2023 home value: $132,256
Non-housing expenditures: $20,401.24

24. Montgomery, Alabama
January 2023 unemployment rate: 2.90%
% of people below poverty line: 15.4
2023 home value: $401,335
Non-housing expenditures: $21,158.20

23. Phoenix
January 2023 unemployment rate: 2.90%
% of people below poverty line: 15.4
2023 home value: $401,335
Non-housing expenditures: $21,158.20
See: Suze Orman Cautions Against Investing Emergency Funds in Two Common Places -- Here's Why

22. Santa Fe, New Mexico
January 2023 unemployment rate: 3.30%
% of people below poverty line: 18.5
2023 home value: $527,906
Non-housing expenditures: $18,556.21

21. Salem, Oregon
January 2023 unemployment rate: 3.60%
% of people below poverty line: 17.6
2023 home value: $676,915
Non-housing expenditures: $23,170.31

20. Boston
January 2023 unemployment rate: 2.70%
% of people below poverty line: 14.5
2023 home value: $422,587
Non-housing expenditures: $20,698.68

19. Nashville, Tennessee
January 2023 unemployment rate: 3.40%
% of people below poverty line: 19.8
2023 home value: $323,892
Non-housing expenditures: $19,483.22
How To Buy ChatGPT Stock: Your 2023 Guide to AI Investing

18. Richmond, Virginia
January 2023 unemployment rate: 3.40%
% of people below poverty line: 19.8
2023 home value: $323,892
Non-housing expenditures: $19,483.22

17. Augusta, Maine
January 2023 unemployment rate: 4.00%
% of people below poverty line: 19.3
2023 home value: $238,910
Non-housing expenditures: $18,705.90

16. Denver
January 2023 unemployment rate: 3.00%
% of people below poverty line: 11.6
2023 home value: $567,384
Non-housing expenditures: $20,592.48

15. Sacramento, California
January 2023 unemployment rate: 4.30%
% of people below poverty line: 14.8
2023 home value: $462,952
Non-housing expenditures: $22,212.16
Check Out: 15 Cities Where Houses Are Best Bargains Right Now
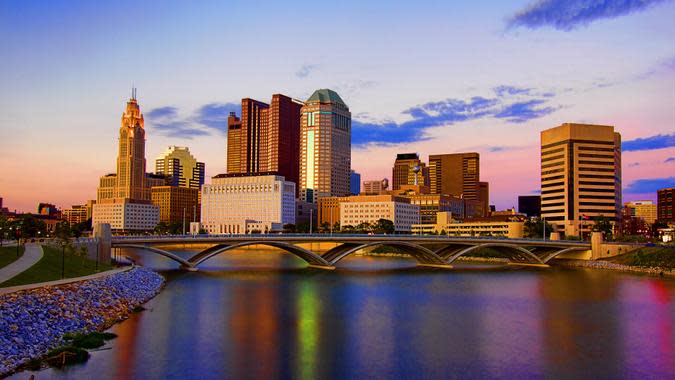
14. Columbus, Ohio
January 2023 unemployment rate: 4.10%
% of people below poverty line: 18.4
2023 home value: $234,537
Non-housing expenditures: $19,506.60

13. Atlanta
January 2023 unemployment rate: 3.20%
% of people below poverty line: 18.5
2023 home value: $374,018
Non-housing expenditures: $21,929.31

12. Honolulu
January 2023 unemployment rate: 3.10%
% of people below poverty line: 11.0
2023 home value: $810,660
Non-housing expenditures: $27,362.99

11. Salt Lake City
January 2023 unemployment rate: 2.50%
% of people below poverty line: 13.3
2023 home value: $536,558
Non-housing expenditures: $19,841.83
$2,000 Quarter? Check Your Pockets Before You Use This 2004 Coin

10. Albany, New York
January 2023 unemployment rate: 4.00
% of people below poverty line: 21.7
2023 home value: $267,515
Non-housing expenditures: $21,297.00
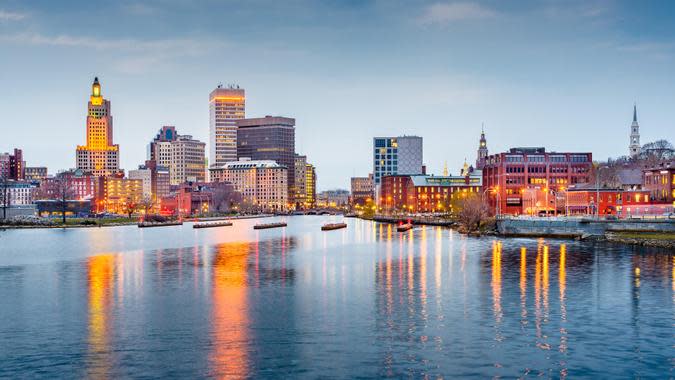
9. Providence, Rhode Island
January 2023 unemployment rate: 3.90%
% of people below poverty line: 21.5
2023 home value: $342,763
Non-housing expenditures: $21,494.12

8. Little Rock, Arkansas
January 2023 unemployment rate: 3.40
% of people below poverty line: 15.6
2023 home value: $189,770
Non-housing expenditures: $18,791.78

7. Harrisburg, Pennsylvania
January 2023 unemployment rate: 3.70%
% of people below poverty line: 28.2
2023 home value: $20,417.79
Non-housing expenditures: $20,417.79
Food Stamps: Surprising Things You Can Buy

6. Baton Rouge, Louisiana
January 2023 unemployment rate: 3.70%
% of people below poverty line: 28.2
2023 home value: $220,537
Non-housing expenditures: $20,417.79

5. Dover, Delaware
January 2023 unemployment rate: 5.20%
% of people below poverty line: 20.5
2023 home value: $296,526
Non-housing expenditures: $20,772.43
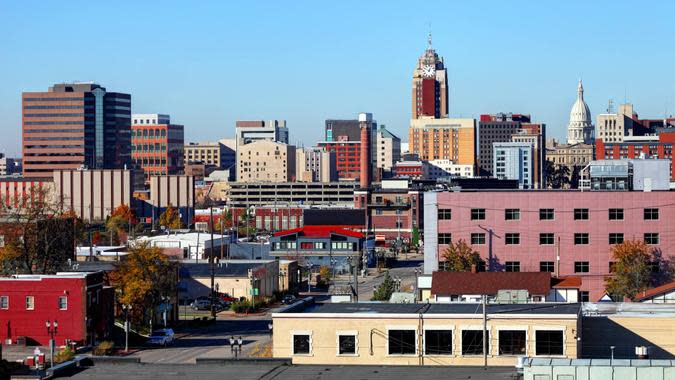
4. Lansing, Michigan
January 2023 unemployment rate: 5.20%
% of people below poverty line: 20.5
2023 home value: $296,526
Non-housing expenditures: $20,772.43

3. Hartford, Connecticut
January 2023 unemployment rate: 5.00%
% of people below poverty line: 21.8
2023 home value: $131,435
Non-housing expenditures: $19,091.44

2. Trenton, New Jersey
January 2023 unemployment rate: 3.30%
% of people below poverty line: 27.7
2023 home value: $261,225
Non-housing expenditures: $21,313.56
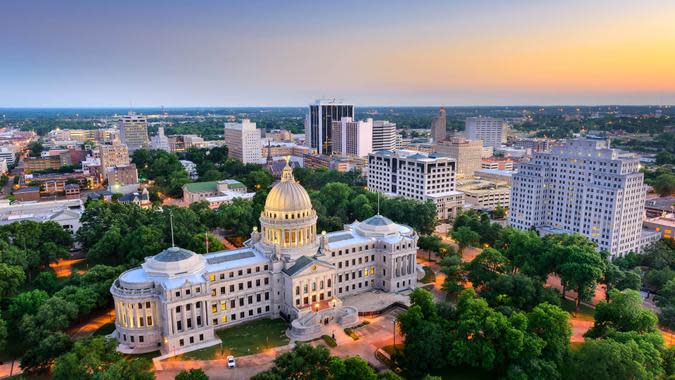
1. Jackson, Mississippi
January 2023 unemployment rate: 4.90%
% of people below poverty line: 26.1
2023 home value: $66,854
Non-housing expenditures: $19,262.27
More From GOBankingRates
Jordan Rosenfeld, Sean Dennison and Jami Farkas contributed to the reporting for this article.
Methodology: GoBankingRates analyzed data from all 50 states capitals to find the best (and worst) capitals to live in. GoBankingRates usedthe following criteria: (1) violent crime rate per 1,000 residents, and (2) property crime rate per 1,000 residents, both sourcedfrom Neighborhood Scout; (3) median home value, sourced from Zillow's 2023 Home Value Index; (4) annual cost of livingexpenditures, based on the Bureau of Labor Statistics' 2021 Consumer Expenditure Survey and local cost of living indicessourced from Sperling's Best Places; (5) school district score, based on Niche's Best School District index; (each school districthad an alphabetical grade, A+ through F, which was converted into a numerical value in order to score); (6) percent ofpopulation living below the poverty line and (7) the median household income sourced from the 2021 American CommunitySurvey done by the United states Census Bureau; and (8) unemployment rate for Janruary 2023 as sourced from the Bureau ofLabor Statistics: Janruary 2023 rates for Metropolitan Areas. All these factors were scored, summed up and then ranked frombest to worst for each state capital. All data was collected and is up-to-date as of April 27th, 2023
This article originally appeared on GOBankingRates.com: The Best and Worst State Capitals To Live In
