
 Yahoo Finance
 Berry Global Group (NYSE:BERY) Might Be Having Difficulty Using Its Capital Effectively
Finding a business that has the potential to grow substantially is not easy, but it is possible if we look at a few key financial metrics. Firstly, we'll want to see a proven return on capital employed (ROCE) that is increasing, and secondly, an expanding base of capital employed. Basically this means that a company has profitable initiatives that it can continue to reinvest in, which is a trait of a compounding machine. Having said that, from a first glance at Berry Global Group (NYSE:BERY) we aren't jumping out of our chairs at how returns are trending, but let's have a deeper look.
Return On Capital Employed (ROCE): What Is It?
For those that aren't sure what ROCE is, it measures the amount of pre-tax profits a company can generate from the capital employed in its business. To calculate this metric for Berry Global Group, this is the formula:
Return on Capital Employed = Earnings Before Interest and Tax (EBIT) ÷ (Total Assets - Current Liabilities)
0.081 = US$1.1b ÷ (US$16b - US$2.3b) (Based on the trailing twelve months to March 2024).
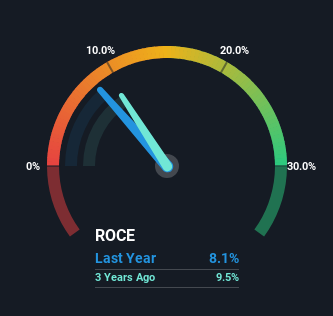
Thus, Berry Global Group has an ROCE of 8.1%. In absolute terms, that's a low return but it's around the Packaging industry average of 9.8%.
Check out our latest analysis for Berry Global Group
In the above chart we have measured Berry Global Group's prior ROCE against its prior performance, but the future is arguably more important. If you'd like, you can check out the forecasts from the analysts covering Berry Global Group for free.
The Trend Of ROCE
When we looked at the ROCE trend at Berry Global Group, we didn't gain much confidence. Around five years ago the returns on capital were 10%, but since then they've fallen to 8.1%. Meanwhile, the business is utilizing more capital but this hasn't moved the needle much in terms of sales in the past 12 months, so this could reflect longer term investments. It's worth keeping an eye on the company's earnings from here on to see if these investments do end up contributing to the bottom line.
What We Can Learn From Berry Global Group's ROCE
In summary, Berry Global Group is reinvesting funds back into the business for growth but unfortunately it looks like sales haven't increased much just yet. And with the stock having returned a mere 13% in the last five years to shareholders, you could argue that they're aware of these lackluster trends. Therefore, if you're looking for a multi-bagger, we'd propose looking at other options.
One more thing: We've identified 3 warning signs with Berry Global Group (at least 1 which makes us a bit uncomfortable) , and understanding these would certainly be useful.
While Berry Global Group isn't earning the highest return, check out this free list of companies that are earning high returns on equity with solid balance sheets.
Have feedback on this article? Concerned about the content? Get in touch with us directly. Alternatively, email editorial-team (at) simplywallst.com.
This article by Simply Wall St is general in nature. We provide commentary based on historical data and analyst forecasts only using an unbiased methodology and our articles are not intended to be financial advice. It does not constitute a recommendation to buy or sell any stock, and does not take account of your objectives, or your financial situation. We aim to bring you long-term focused analysis driven by fundamental data. Note that our analysis may not factor in the latest price-sensitive company announcements or qualitative material. Simply Wall St has no position in any stocks mentioned.
Have feedback on this article? Concerned about the content? Get in touch with us directly. Alternatively, email editorial-team@simplywallst.com
