
 Yahoo Finance
 Bengal Energy's (TSE:BNG) Returns On Capital Are Heading Higher
If we want to find a stock that could multiply over the long term, what are the underlying trends we should look for? Ideally, a business will show two trends; firstly a growing return on capital employed (ROCE) and secondly, an increasing amount of capital employed. If you see this, it typically means it's a company with a great business model and plenty of profitable reinvestment opportunities. So when we looked at Bengal Energy (TSE:BNG) and its trend of ROCE, we really liked what we saw.
What Is Return On Capital Employed (ROCE)?
Just to clarify if you're unsure, ROCE is a metric for evaluating how much pre-tax income (in percentage terms) a company earns on the capital invested in its business. The formula for this calculation on Bengal Energy is:
Return on Capital Employed = Earnings Before Interest and Tax (EBIT) ÷ (Total Assets - Current Liabilities)
0.0095 = CA$444k ÷ (CA$50m - CA$3.1m) (Based on the trailing twelve months to March 2023).
Therefore, Bengal Energy has an ROCE of 1.0%. Ultimately, that's a low return and it under-performs the Oil and Gas industry average of 15%.
View our latest analysis for Bengal Energy
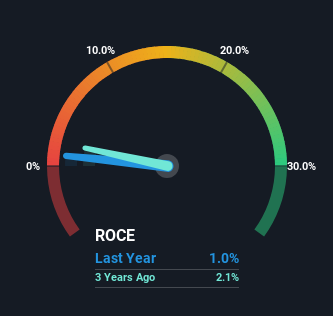
Historical performance is a great place to start when researching a stock so above you can see the gauge for Bengal Energy's ROCE against it's prior returns. If you want to delve into the historical earnings, revenue and cash flow of Bengal Energy, check out these free graphs here.
What Does the ROCE Trend For Bengal Energy Tell Us?
Shareholders will be relieved that Bengal Energy has broken into profitability. The company now earns 1.0% on its capital, because five years ago it was incurring losses. Interestingly, the capital employed by the business has remained relatively flat, so these higher returns are either from prior investments paying off or increased efficiencies. With no noticeable increase in capital employed, it's worth knowing what the company plans on doing going forward in regards to reinvesting and growing the business. So if you're looking for high growth, you'll want to see a business's capital employed also increasing.
The Bottom Line
To bring it all together, Bengal Energy has done well to increase the returns it's generating from its capital employed. Astute investors may have an opportunity here because the stock has declined 57% in the last five years. That being the case, research into the company's current valuation metrics and future prospects seems fitting.
One more thing: We've identified 2 warning signs with Bengal Energy (at least 1 which is significant) , and understanding these would certainly be useful.
If you want to search for solid companies with great earnings, check out this free list of companies with good balance sheets and impressive returns on equity.
Have feedback on this article? Concerned about the content? Get in touch with us directly. Alternatively, email editorial-team (at) simplywallst.com.
This article by Simply Wall St is general in nature. We provide commentary based on historical data and analyst forecasts only using an unbiased methodology and our articles are not intended to be financial advice. It does not constitute a recommendation to buy or sell any stock, and does not take account of your objectives, or your financial situation. We aim to bring you long-term focused analysis driven by fundamental data. Note that our analysis may not factor in the latest price-sensitive company announcements or qualitative material. Simply Wall St has no position in any stocks mentioned.
