
 Yahoo Finance
 Is Belvoir Group PLC's (LON:BLV) Stock's Recent Performance Being Led By Its Attractive Financial Prospects?
Belvoir Group (LON:BLV) has had a great run on the share market with its stock up by a significant 14% over the last month. Since the market usually pay for a company’s long-term fundamentals, we decided to study the company’s key performance indicators to see if they could be influencing the market. Specifically, we decided to study Belvoir Group's ROE in this article.
ROE or return on equity is a useful tool to assess how effectively a company can generate returns on the investment it received from its shareholders. In other words, it is a profitability ratio which measures the rate of return on the capital provided by the company's shareholders.
Check out our latest analysis for Belvoir Group
How Is ROE Calculated?
Return on equity can be calculated by using the formula:
Return on Equity = Net Profit (from continuing operations) ÷ Shareholders' Equity
So, based on the above formula, the ROE for Belvoir Group is:
22% = UK£7.4m ÷ UK£34m (Based on the trailing twelve months to December 2021).
The 'return' is the yearly profit. That means that for every £1 worth of shareholders' equity, the company generated £0.22 in profit.
What Is The Relationship Between ROE And Earnings Growth?
So far, we've learned that ROE is a measure of a company's profitability. Depending on how much of these profits the company reinvests or "retains", and how effectively it does so, we are then able to assess a company’s earnings growth potential. Assuming all else is equal, companies that have both a higher return on equity and higher profit retention are usually the ones that have a higher growth rate when compared to companies that don't have the same features.
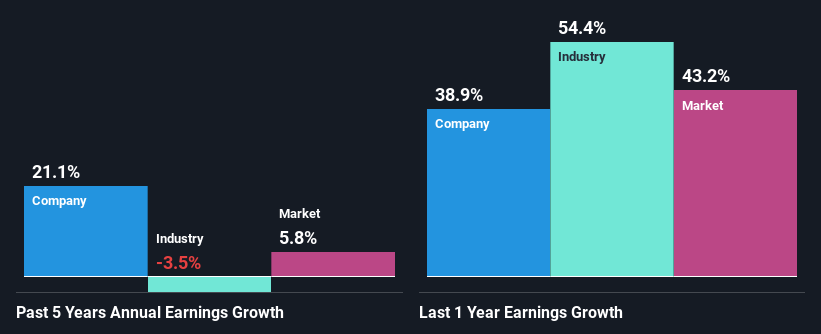
Belvoir Group's Earnings Growth And 22% ROE
First thing first, we like that Belvoir Group has an impressive ROE. Second, a comparison with the average ROE reported by the industry of 11% also doesn't go unnoticed by us. Under the circumstances, Belvoir Group's considerable five year net income growth of 21% was to be expected.
When you consider the fact that the industry earnings have shrunk at a rate of 3.5% in the same period, the company's net income growth is pretty remarkable.
The basis for attaching value to a company is, to a great extent, tied to its earnings growth. It’s important for an investor to know whether the market has priced in the company's expected earnings growth (or decline). This then helps them determine if the stock is placed for a bright or bleak future. Is Belvoir Group fairly valued compared to other companies? These 3 valuation measures might help you decide.
Is Belvoir Group Making Efficient Use Of Its Profits?
Belvoir Group's three-year median payout ratio is a pretty moderate 43%, meaning the company retains 57% of its income. By the looks of it, the dividend is well covered and Belvoir Group is reinvesting its profits efficiently as evidenced by its exceptional growth which we discussed above.
Besides, Belvoir Group has been paying dividends for at least ten years or more. This shows that the company is committed to sharing profits with its shareholders. Our latest analyst data shows that the future payout ratio of the company over the next three years is expected to be approximately 48%. Accordingly, forecasts suggest that Belvoir Group's future ROE will be 18% which is again, similar to the current ROE.
Summary
In total, we are pretty happy with Belvoir Group's performance. Particularly, we like that the company is reinvesting heavily into its business, and at a high rate of return. Unsurprisingly, this has led to an impressive earnings growth. That being so, according to the latest industry analyst forecasts, the company's earnings are expected to shrink in the future. Are these analysts expectations based on the broad expectations for the industry, or on the company's fundamentals? Click here to be taken to our analyst's forecasts page for the company.
Have feedback on this article? Concerned about the content? Get in touch with us directly. Alternatively, email editorial-team (at) simplywallst.com.
This article by Simply Wall St is general in nature. We provide commentary based on historical data and analyst forecasts only using an unbiased methodology and our articles are not intended to be financial advice. It does not constitute a recommendation to buy or sell any stock, and does not take account of your objectives, or your financial situation. We aim to bring you long-term focused analysis driven by fundamental data. Note that our analysis may not factor in the latest price-sensitive company announcements or qualitative material. Simply Wall St has no position in any stocks mentioned.
