
 Yahoo Finance
 Beeks Financial Cloud Group (LON:BKS) May Have Issues Allocating Its Capital
If you're looking for a multi-bagger, there's a few things to keep an eye out for. Amongst other things, we'll want to see two things; firstly, a growing return on capital employed (ROCE) and secondly, an expansion in the company's amount of capital employed. If you see this, it typically means it's a company with a great business model and plenty of profitable reinvestment opportunities. However, after briefly looking over the numbers, we don't think Beeks Financial Cloud Group (LON:BKS) has the makings of a multi-bagger going forward, but let's have a look at why that may be.
Return On Capital Employed (ROCE): What Is It?
If you haven't worked with ROCE before, it measures the 'return' (pre-tax profit) a company generates from capital employed in its business. Analysts use this formula to calculate it for Beeks Financial Cloud Group:
Return on Capital Employed = Earnings Before Interest and Tax (EBIT) ÷ (Total Assets - Current Liabilities)
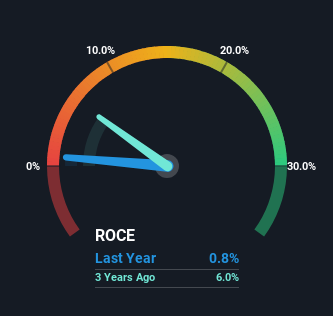
0.0081 = UK£320k ÷ (UK£47m - UK£7.6m) (Based on the trailing twelve months to December 2023).
Thus, Beeks Financial Cloud Group has an ROCE of 0.8%. In absolute terms, that's a low return and it also under-performs the IT industry average of 12%.
Check out our latest analysis for Beeks Financial Cloud Group
In the above chart we have measured Beeks Financial Cloud Group's prior ROCE against its prior performance, but the future is arguably more important. If you're interested, you can view the analysts predictions in our free analyst report for Beeks Financial Cloud Group .
What Does the ROCE Trend For Beeks Financial Cloud Group Tell Us?
In terms of Beeks Financial Cloud Group's historical ROCE movements, the trend isn't fantastic. Over the last five years, returns on capital have decreased to 0.8% from 26% five years ago. However, given capital employed and revenue have both increased it appears that the business is currently pursuing growth, at the consequence of short term returns. And if the increased capital generates additional returns, the business, and thus shareholders, will benefit in the long run.
The Bottom Line
Even though returns on capital have fallen in the short term, we find it promising that revenue and capital employed have both increased for Beeks Financial Cloud Group. And the stock has followed suit returning a meaningful 76% to shareholders over the last five years. So should these growth trends continue, we'd be optimistic on the stock going forward.
Beeks Financial Cloud Group does come with some risks though, we found 2 warning signs in our investment analysis, and 1 of those is concerning...
While Beeks Financial Cloud Group isn't earning the highest return, check out this free list of companies that are earning high returns on equity with solid balance sheets.
Have feedback on this article? Concerned about the content? Get in touch with us directly. Alternatively, email editorial-team (at) simplywallst.com.
This article by Simply Wall St is general in nature. We provide commentary based on historical data and analyst forecasts only using an unbiased methodology and our articles are not intended to be financial advice. It does not constitute a recommendation to buy or sell any stock, and does not take account of your objectives, or your financial situation. We aim to bring you long-term focused analysis driven by fundamental data. Note that our analysis may not factor in the latest price-sensitive company announcements or qualitative material. Simply Wall St has no position in any stocks mentioned.
