
 Yahoo Finance
 Becton Dickinson & Co's Dividend Analysis
Exploring the Dividend Sustainability and Growth Prospects of Becton Dickinson & Co
Becton Dickinson & Co (NYSE:BDX) recently announced a dividend of $0.95 per share, payable on 2024-06-28, with the ex-dividend date set for 2024-06-10. As investors look forward to this upcoming payment, the spotlight also shines on the company's dividend history, yield, and growth rates. Using the data from GuruFocus, let's look into Becton Dickinson & Co's dividend performance and assess its sustainability.
What Does Becton Dickinson & Co Do?
This Powerful Chart Made Peter Lynch 29% A Year For 13 Years
How to calculate the intrinsic value of a stock?
Becton, Dickinson is the world's largest manufacturer and distributor of medical surgical products, such as needles, syringes, and sharps-disposal units. The company also manufactures pre-filled devices, diagnostic instruments and reagents, as well as flow cytometry and cell-imaging systems. BD Medical is nearly half of the total business, while BD Life Sciences (27% of 2023 revenue) and BD Interventional (24%) account for the remainder. International revenue accounts for 43% of the company's business.

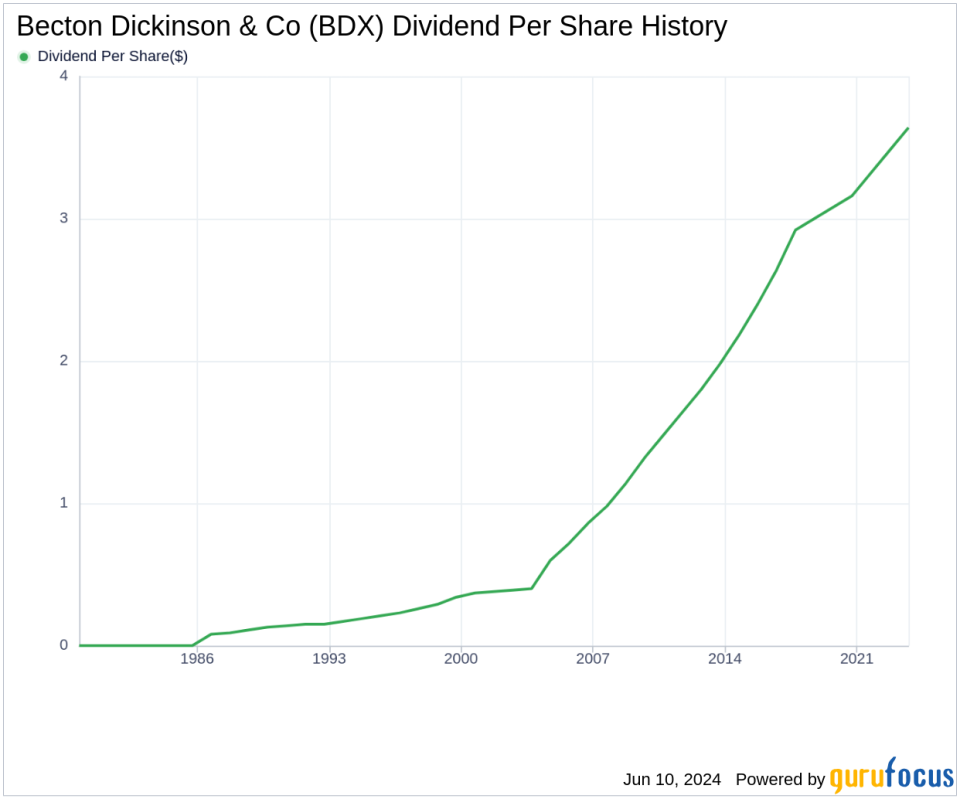
A Glimpse at Becton Dickinson & Co's Dividend History
Becton Dickinson & Co has maintained a consistent dividend payment record since 1972. Dividends are currently distributed on a quarterly basis. Becton Dickinson & Co has increased its dividend each year since 1972. The stock is thus listed as a dividend king, an honor that is given to companies that have increased their dividend each year for at least the past 52 years. Below is a chart showing annual Dividends Per Share for tracking historical trends.
Breaking Down Becton Dickinson & Co's Dividend Yield and Growth
As of today, Becton Dickinson & Co currently has a 12-month trailing dividend yield of 1.55% and a 12-month forward dividend yield of 1.58%. This suggests an expectation of increased dividend payments over the next 12 months. Over the past three years, Becton Dickinson & Co's annual dividend growth rate was 4.80%. Extended to a five-year horizon, this rate decreased to 4.00% per year. And over the past decade, Becton Dickinson & Co's annual dividends per share growth rate stands at 5.90%.
Based on Becton Dickinson & Co's dividend yield and five-year growth rate, the 5-year yield on cost of Becton Dickinson & Co stock as of today is approximately 1.87%.

The Sustainability Question: Payout Ratio and Profitability
To assess the sustainability of the dividend, one needs to evaluate the company's payout ratio. The dividend payout ratio provides insights into the portion of earnings the company distributes as dividends. A lower ratio suggests that the company retains a significant part of its earnings, thereby ensuring the availability of funds for future growth and unexpected downturns. As of 2024-03-31, Becton Dickinson & Co's dividend payout ratio is 0.38.
Becton Dickinson & Co's profitability rank, offers an understanding of the company's earnings prowess relative to its peers. GuruFocus ranks Becton Dickinson & Co's profitability 7 out of 10 as of 2024-03-31, suggesting good profitability prospects. The company has reported positive net income for each of year over the past decade, further solidifying its high profitability.
Growth Metrics: The Future Outlook
To ensure the sustainability of dividends, a company must have robust growth metrics. Becton Dickinson & Co's growth rank of 7 out of 10 suggests that the company's growth trajectory is good relative to its competitors. Revenue is the lifeblood of any company, and Becton Dickinson & Co's revenue per share, combined with the 3-year revenue growth rate, indicates a strong revenue model. Becton Dickinson & Co's revenue has increased by approximately 5.70% per year on average, a rate that underperforms than approximately 53.69% of global competitors.
The company's 3-year EPS growth rate showcases its capability to grow its earnings, a critical component for sustaining dividends in the long run. During the past three years, Becton Dickinson & Co's earnings increased by approximately 87.70% per year on average, a rate that underperforms than approximately 2.71% of global competitors.
Lastly, the company's 5-year EBITDA growth rate of 36.90%, which underperforms than approximately 13.76% of global competitors.
With Becton Dickinson & Co's consistent dividend payments, a robust dividend growth rate, and a sustainable payout ratio, the company stands as a compelling choice for dividend investors. The solid profitability and growth metrics further enhance its attractiveness, suggesting a promising outlook for maintaining, if not increasing, dividend distributions in the future. GuruFocus Premium users can screen for high-dividend yield stocks using the High Dividend Yield Screener.
This article, generated by GuruFocus, is designed to provide general insights and is not tailored financial advice. Our commentary is rooted in historical data and analyst projections, utilizing an impartial methodology, and is not intended to serve as specific investment guidance. It does not formulate a recommendation to purchase or divest any stock and does not consider individual investment objectives or financial circumstances. Our objective is to deliver long-term, fundamental data-driven analysis. Be aware that our analysis might not incorporate the most recent, price-sensitive company announcements or qualitative information. GuruFocus holds no position in the stocks mentioned herein.
This article first appeared on GuruFocus.
