
 Yahoo Finance
 Is Badger Daylighting Ltd. (TSE:BAD) A Volatile Stock?

Anyone researching Badger Daylighting Ltd. (TSE:BAD) might want to consider the historical volatility of the share price. Modern finance theory considers volatility to be a measure of risk, and there are two main types of price volatility. The first category is company specific volatility. This can be dealt with by limiting your exposure to any particular stock. The second sort is caused by the natural volatility of markets, overall. For example, certain macroeconomic events will impact (virtually) all stocks on the market.
Some stocks see their prices move in concert with the market. Others tend towards stronger, gentler or unrelated price movements. Beta can be a useful tool to understand how much a stock is influenced by market risk (volatility). However, Warren Buffett said 'volatility is far from synonymous with risk' in his 2014 letter to investors. So, while useful, beta is not the only metric to consider. To use beta as an investor, you must first understand that the overall market has a beta of one. Any stock with a beta of greater than one is considered more volatile than the market, while those with a beta below one are either less volatile or poorly correlated with the market.
See our latest analysis for Badger Daylighting
What BAD's beta value tells investors
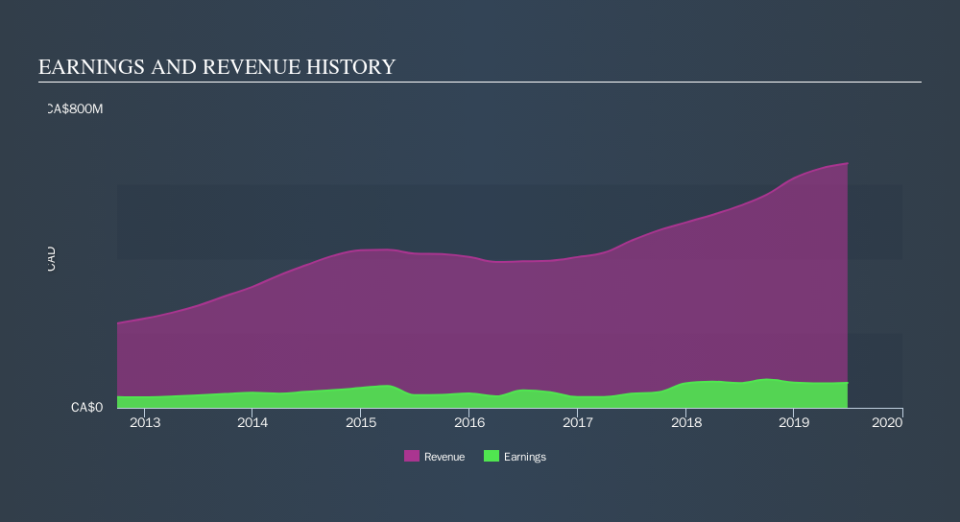
Zooming in on Badger Daylighting, we see it has a five year beta of 1.17. This is above 1, so historically its share price has been influenced by the broader volatility of the stock market. If the past is any guide, we would expect that Badger Daylighting shares will rise quicker than the markets in times of optimism, but fall faster in times of pessimism. Many would argue that beta is useful in position sizing, but fundamental metrics such as revenue and earnings are more important overall. You can see Badger Daylighting's revenue and earnings in the image below.
Could BAD's size cause it to be more volatile?
Badger Daylighting is a small company, but not tiny and little known. It has a market capitalisation of CA$1.5b, which means it would be on the radar of intstitutional investors. It is quite common to see a small-cap stock with a beta greater than one. In part, that's because relatively few investors can influence the price of a smaller company, compared to a large company.
What this means for you:
Since Badger Daylighting has a reasonably high beta, it's worth considering why it is so heavily influenced by broader market sentiment. For example, it might be a high growth stock or have a lot of operating leverage in its business model. In order to fully understand whether BAD is a good investment for you, we also need to consider important company-specific fundamentals such as Badger Daylighting’s financial health and performance track record. I urge you to continue your research by taking a look at the following:
Future Outlook: What are well-informed industry analysts predicting for BAD’s future growth? Take a look at our free research report of analyst consensus for BAD’s outlook.
Past Track Record: Has BAD been consistently performing well irrespective of the ups and downs in the market? Go into more detail in the past performance analysis and take a look at the free visual representations of BAD's historicals for more clarity.
Other Interesting Stocks: It's worth checking to see how BAD measures up against other companies on valuation. You could start with this free list of prospective options.
We aim to bring you long-term focused research analysis driven by fundamental data. Note that our analysis may not factor in the latest price-sensitive company announcements or qualitative material.
If you spot an error that warrants correction, please contact the editor at editorial-team@simplywallst.com. This article by Simply Wall St is general in nature. It does not constitute a recommendation to buy or sell any stock, and does not take account of your objectives, or your financial situation. Simply Wall St has no position in the stocks mentioned. Thank you for reading.
