
 Yahoo Finance
 Is B2Gold Corp’s (TSE:BTO) Balance Sheet A Threat To Its Future?

Small-caps and large-caps are wildly popular among investors; however, mid-cap stocks, such as B2Gold Corp (TSE:BTO) with a market-capitalization of CA$3.2b, rarely draw their attention. Despite this, commonly overlooked mid-caps have historically produced better risk-adjusted returns than their small and large-cap counterparts. Today we will look at BTO’s financial liquidity and debt levels, which are strong indicators for whether the company can weather economic downturns or fund strategic acquisitions for future growth. Remember this is a very top-level look that focuses exclusively on financial health, so I recommend a deeper analysis into BTO here.
See our latest analysis for B2Gold
How does BTO’s operating cash flow stack up against its debt?
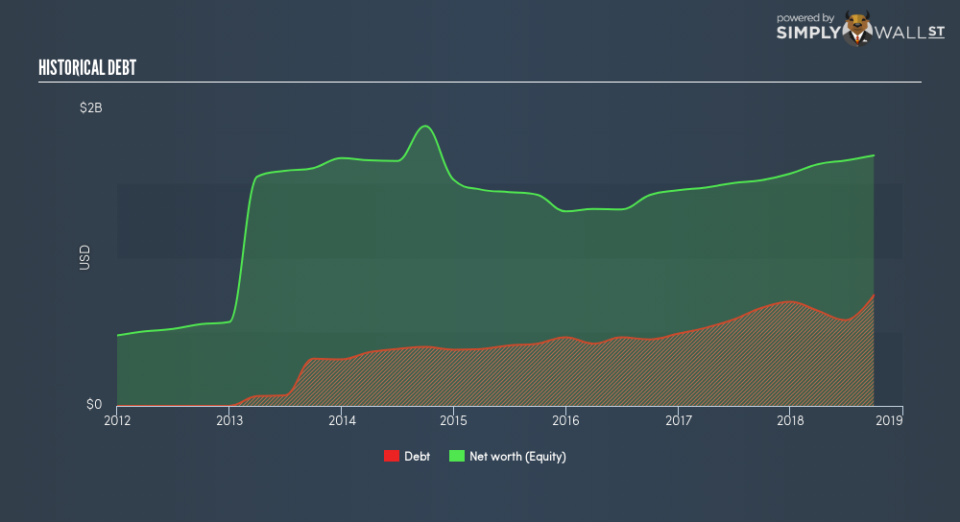
Over the past year, BTO has ramped up its debt from US$662m to US$747m , which accounts for long term debt. With this growth in debt, BTO currently has US$355m remaining in cash and short-term investments , ready to deploy into the business. On top of this, BTO has generated cash from operations of US$402m during the same period of time, resulting in an operating cash to total debt ratio of 54%, indicating that BTO’s current level of operating cash is high enough to cover debt. This ratio can also be a sign of operational efficiency as an alternative to return on assets. In BTO’s case, it is able to generate 0.54x cash from its debt capital.
Can BTO pay its short-term liabilities?
With current liabilities at US$486m, the company has maintained a safe level of current assets to meet its obligations, with the current ratio last standing at 1.27x. For Metals and Mining companies, this ratio is within a sensible range as there’s enough of a cash buffer without holding too much capital in low return investments.
Does BTO face the risk of succumbing to its debt-load?
With a debt-to-equity ratio of 44%, BTO can be considered as an above-average leveraged company. This is not unusual for mid-caps as debt tends to be a cheaper and faster source of funding for some businesses. No matter how high the company’s debt, if it can easily cover the interest payments, it’s considered to be efficient with its use of excess leverage. A company generating earnings after interest and tax at least three times its net interest payments is considered financially sound. In BTO’s case, the ratio of 8.39x suggests that interest is appropriately covered, which means that debtors may be willing to loan the company more money, giving BTO ample headroom to grow its debt facilities.
Next Steps:
Although BTO’s debt level is towards the higher end of the spectrum, its cash flow coverage seems adequate to meet obligations which means its debt is being efficiently utilised. This may mean this is an optimal capital structure for the business, given that it is also meeting its short-term commitment. I admit this is a fairly basic analysis for BTO’s financial health. Other important fundamentals need to be considered alongside. You should continue to research B2Gold to get a better picture of the mid-cap by looking at:
Future Outlook: What are well-informed industry analysts predicting for BTO’s future growth? Take a look at our free research report of analyst consensus for BTO’s outlook.
Valuation: What is BTO worth today? Is the stock undervalued, even when its growth outlook is factored into its intrinsic value? The intrinsic value infographic in our free research report helps visualize whether BTO is currently mispriced by the market.
Other High-Performing Stocks: Are there other stocks that provide better prospects with proven track records? Explore our free list of these great stocks here.
To help readers see past the short term volatility of the financial market, we aim to bring you a long-term focused research analysis purely driven by fundamental data. Note that our analysis does not factor in the latest price-sensitive company announcements.
The author is an independent contributor and at the time of publication had no position in the stocks mentioned. For errors that warrant correction please contact the editor at editorial-team@simplywallst.com.
