
 Yahoo Finance
 Is Avante Logixx Inc’s (CVE:XX) Balance Sheet A Threat To Its Future?

Avante Logixx Inc (CVE:XX) is a small-cap stock with a market capitalization of CA$45.48m. While investors primarily focus on the growth potential and competitive landscape of the small-cap companies, they end up ignoring a key aspect, which could be the biggest threat to its existence: its financial health. Why is it important? Since XX is loss-making right now, it’s vital to understand the current state of its operations and pathway to profitability. Here are a few basic checks that are good enough to have a broad overview of the company’s financial strength. However, given that I have not delve into the company-specifics, I recommend you dig deeper yourself into XX here.
Does XX produce enough cash relative to debt?
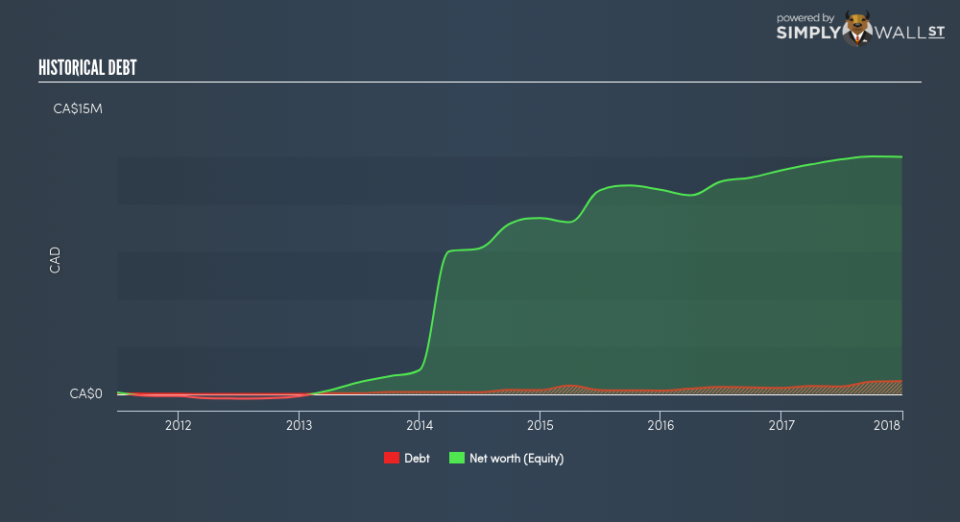
XX’s debt levels surged from CA$278.73k to CA$425.32k over the last 12 months – this includes both the current and long-term debt. With this increase in debt, XX currently has CA$2.33m remaining in cash and short-term investments , ready to deploy into the business. Moreover, XX has produced CA$1.94m in operating cash flow during the same period of time, leading to an operating cash to total debt ratio of 455.71%, meaning that XX’s debt is appropriately covered by operating cash. This ratio can also be interpreted as a measure of efficiency for loss making businesses since metrics such as return on asset (ROA) requires a positive net income. In XX’s case, it is able to generate 4.56x cash from its debt capital.
Does XX’s liquid assets cover its short-term commitments?
Looking at XX’s most recent CA$5.91m liabilities, it seems that the business has maintained a safe level of current assets to meet its obligations, with the current ratio last standing at 1.47x. For Consumer Services companies, this ratio is within a sensible range since there is a bit of a cash buffer without leaving too much capital in a low-return environment.
Can XX service its debt comfortably?
With a debt-to-equity ratio of 5.37%, XX’s debt level is relatively low. This range is considered safe as XX is not taking on too much debt obligation, which may be constraining for future growth. XX’s risk around capital structure is almost non-existent, and the company has the headroom and ability to raise debt should it need to in the future.
Next Steps:
XX’s high cash coverage and low debt levels indicate its ability to utilise its borrowings efficiently in order to generate ample cash flow. In addition to this, the company exhibits proper management of current assets and upcoming liabilities. Keep in mind I haven’t considered other factors such as how XX has been performing in the past. I suggest you continue to research Avante Logixx to get a more holistic view of the stock by looking at:
Future Outlook: What are well-informed industry analysts predicting for XX’s future growth? Take a look at our free research report of analyst consensus for XX’s outlook.
Valuation: What is XX worth today? Is the stock undervalued, even when its growth outlook is factored into its intrinsic value? The intrinsic value infographic in our free research report helps visualize whether XX is currently mispriced by the market.
Other High-Performing Stocks: Are there other stocks that provide better prospects with proven track records? Explore our free list of these great stocks here.
To help readers see pass the short term volatility of the financial market, we aim to bring you a long-term focused research analysis purely driven by fundamental data. Note that our analysis does not factor in the latest price sensitive company announcements.
The author is an independent contributor and at the time of publication had no position in the stocks mentioned.
