
 Yahoo Finance
 Is Auryn Resources Inc’s (TSE:AUG) 11.9% ROE Strong Compared To Its Industry?

This article is intended for those of you who are at the beginning of your investing journey and want to start learning about core concepts of fundamental analysis on practical examples from today’s market.
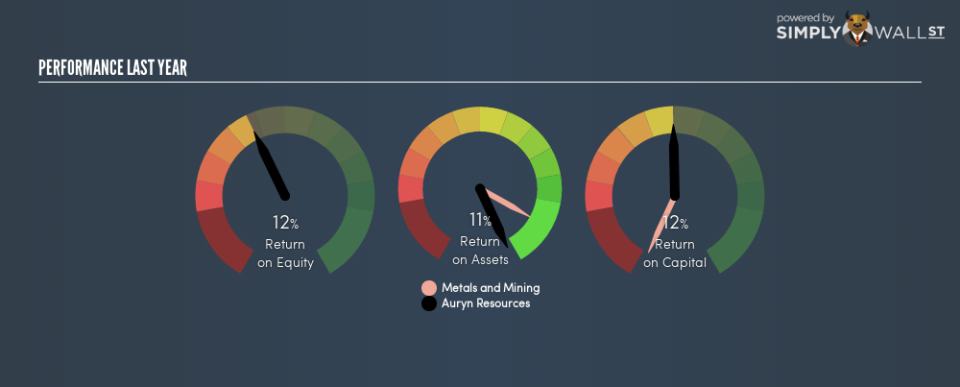
Auryn Resources Inc (TSE:AUG) outperformed the Diversified Metals and Mining industry on the basis of its ROE – producing a higher 11.9% relative to the peer average of 11.8% over the past 12 months. Superficially, this looks great since we know that AUG has generated big profits with little equity capital; however, ROE doesn’t tell us how much AUG has borrowed in debt. We’ll take a closer look today at factors like financial leverage to determine whether AUG’s ROE is actually sustainable.
See our latest analysis for Auryn Resources
What you must know about ROE
Return on Equity (ROE) is a measure of Auryn Resources’s profit relative to its shareholders’ equity. An ROE of 11.9% implies CA$0.12 returned on every CA$1 invested. In most cases, a higher ROE is preferred; however, there are many other factors we must consider prior to making any investment decisions.
Return on Equity = Net Profit ÷ Shareholders Equity
Returns are usually compared to costs to measure the efficiency of capital. Auryn Resources’s cost of equity is 16.0%. This means Auryn Resources’s returns actually do not cover its own cost of equity, with a discrepancy of -4.1%. This isn’t sustainable as it implies, very simply, that the company pays more for its capital than what it generates in return. ROE can be split up into three useful ratios: net profit margin, asset turnover, and financial leverage. This is called the Dupont Formula:
Dupont Formula
ROE = profit margin × asset turnover × financial leverage
ROE = (annual net profit ÷ sales) × (sales ÷ assets) × (assets ÷ shareholders’ equity)
ROE = annual net profit ÷ shareholders’ equity
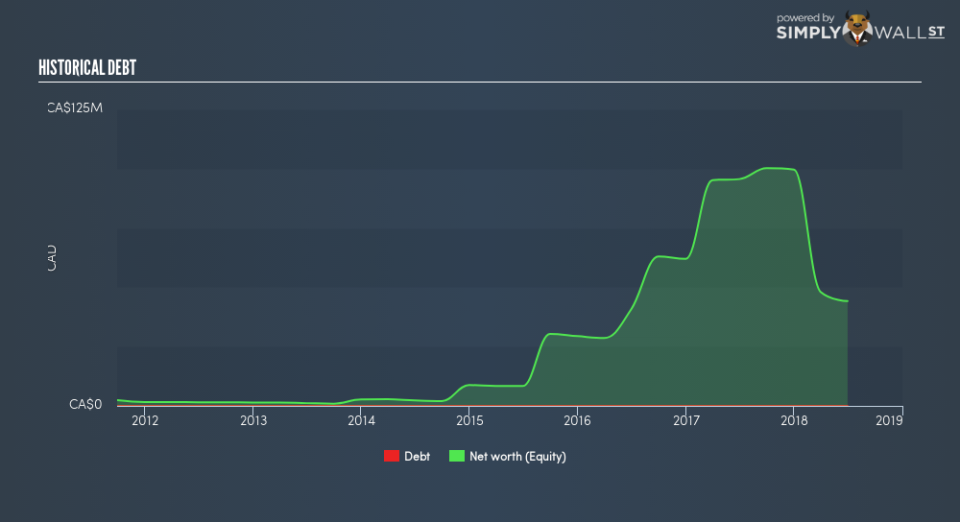
Essentially, profit margin shows how much money the company makes after paying for all its expenses. The other component, asset turnover, illustrates how much revenue Auryn Resources can make from its asset base. And finally, financial leverage is simply how much of assets are funded by equity, which exhibits how sustainable the company’s capital structure is. Since ROE can be inflated by excessive debt, we need to examine Auryn Resources’s debt-to-equity level. Currently, Auryn Resources has no debt which means its returns are driven purely by equity capital. Therefore, the level of financial leverage has no impact on ROE, and the ratio is a representative measure of the efficiency of all its capital employed firm-wide.
Next Steps:
ROE is a simple yet informative ratio, illustrating the various components that each measure the quality of the overall stock. Auryn Resources’s ROE is impressive relative to the industry average, though its returns were not strong enough to cover its own cost of equity. Its high ROE is not likely to be driven by high debt. Therefore, investors may have more confidence in the sustainability of this level of returns going forward. Although ROE can be a useful metric, it is only a small part of diligent research.
For Auryn Resources, I’ve put together three pertinent aspects you should further examine:
Financial Health: Does it have a healthy balance sheet? Take a look at our free balance sheet analysis with six simple checks on key factors like leverage and risk.
Management:Have insiders been ramping up their shares to take advantage of the market’s sentiment for Auryn Resources’s future outlook? Check out our management and board analysis with insights on CEO compensation and governance factors.
Other High-Growth Alternatives : Are there other high-growth stocks you could be holding instead of Auryn Resources? Explore our interactive list of stocks with large growth potential to get an idea of what else is out there you may be missing!
To help readers see past the short term volatility of the financial market, we aim to bring you a long-term focused research analysis purely driven by fundamental data. Note that our analysis does not factor in the latest price-sensitive company announcements.
The author is an independent contributor and at the time of publication had no position in the stocks mentioned. For errors that warrant correction please contact the editor at editorial-team@simplywallst.com.
