
 Yahoo Finance
 AUDCAD Leaves no Hope for Buyers
Till the end of June, AUDCAD was fighting to keep the positive/neutral sentiment alive. As we can see now, buyers failed and are paying a very high price for that.
The long-term situation here is super negative. The price is under the influence of the big head and shoulders pattern, which was created between the February and July. Last week, sellers managed to break the neck line (and in the same time a horizontal support on the 0.997 – green area). That increased the bearish momentum and send the price even lower allowing to break the long-term up trendline (from June 2016 – blue). After that, we had a typical technical comeback, which tested that recent support as a closest resistance. Test went great for the supply and after that the price made new lower lows.
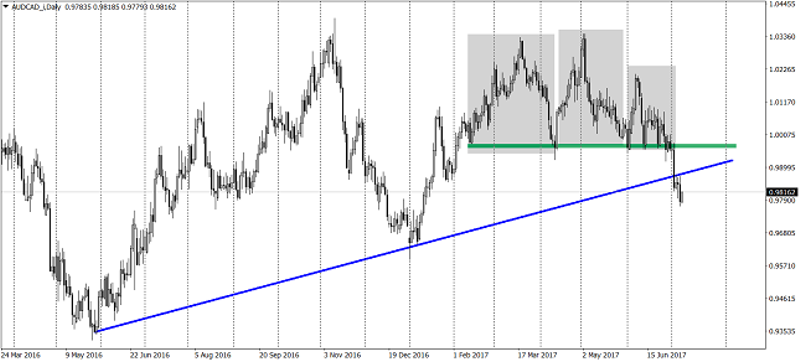
With such significant signs from the price action, the sentiment has to be negative. Even if in the next few days we will experience an upswing, the outlook will be still negative, at least as long as we stay below the 0.997 (neckline). The closest aim for the sellers should be yearly lows set at the beginning of the January. With the price being under the influence of the H&S formation and under the up trendline, I see no other option.
This article is written by Tomasz Wisniewski, a senior analyst at Alpari Research & Analysis
This article was originally posted on FX Empire
