
 Yahoo Finance
 AUD/USD and NZD/USD Fundamental Daily Forecast – May Be Ripe for Short-Term Counter-Trend Rally
The Australian and New Zealand Dollars posted reversals to the upside on Thursday with both currencies responding to key technical support zones. The price action does not mean their trends are about to turn up, but it could be an indication that the buying is greater than the selling at current price levels. This tends to occur when markets are oversold.
The chart pattern suggests the AUD/USD and NZD/USD may be ripe for a 2 to 3 counter-trend rally that will alleviate some of the excessive selling pressure while allowing bearish traders to book a little profit, regroup then re-short at better price levels.
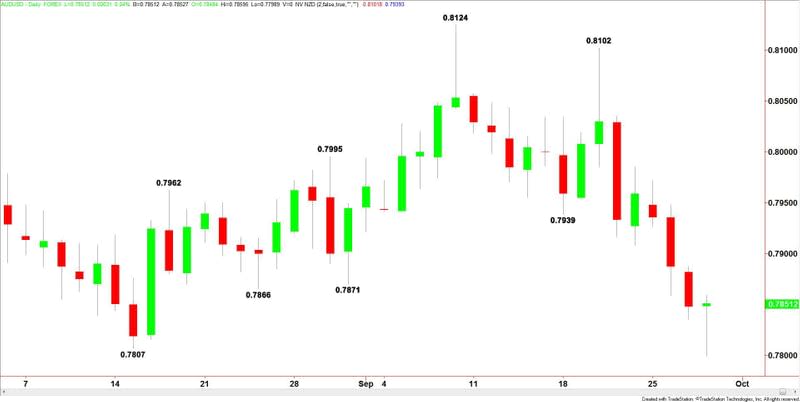
For AUD/USD traders, the current range is formed by the July 5 bottom at .7571 and the September 8 top at .8124. The 50% to 61.8% retracement zone of this range is .7847 to .7782. This zone is currently being tested.
Today’s technical bounce inside this zone is a normal reaction. However, if the selling is ever strong enough to cross to the weak side of .7782 then look out to the downside.
The main range for the NZD/USD is the May 11 bottom at .6817 and the July 27 top at .7558. Its 50% to 61.8% retracement zone is .7187 to .7100. A main bottom at .7130 from August 31 also falls inside this zone.
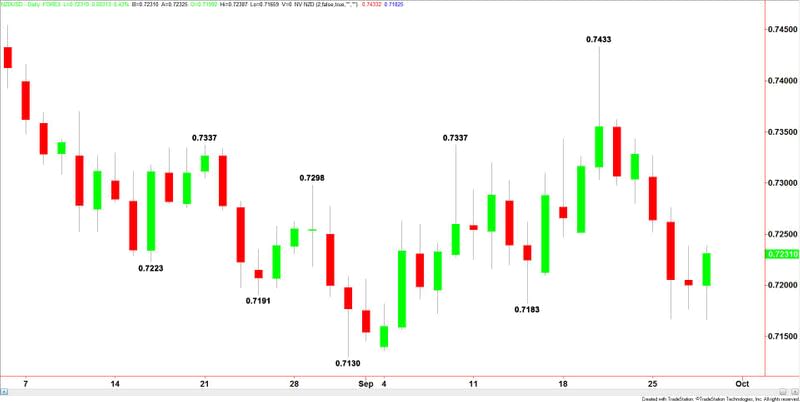
Over the past month, we’ve seen investors respond to this zone several times. However, if sellers take out the bottom of the retracement zone at .7100 with conviction then look for prices to collapse.
Thursday’s price action was all about trading and not really about the fundamentals. The Aussie and Kiwi were driven lower this week by hawkish comments by Fed Chair Janet Yellen and the release of the Trump Administration’s long-awaited tax reform plan.
When today’s U.S. Final GDP report came out better than expected and the U.S. Dollar showed almost no reaction, I think this gave bearish AUD/USD and NZD/USD traders an excuse to start booking profits.
I guess you can say that some tops and bottoms are major turns triggered by key economic events and others are simply fueled by profit-taking and counter-trend buying and selling. I don’t think a rally by the AUD/USD and NZD/USD at this time will hurt anybody’s long-term plans.
Investors are essentially monitoring the interest rate differential between the U.S. and Australia and New Zealand. And with the Fed likely to raise rates again in December and the RBA and RBNZ sitting at neutral, the U.S. Dollar is a more attractive investment.
The next rally by the AUD/USD and NZD/USD is designed to set up another secondary lower top which will send a signal to traders that these Forex pairs are headed lower.
This article was originally posted on FX Empire
More From FXEMPIRE:
AUD/USD and NZD/USD Fundamental Daily Forecast – May Be Ripe for Short-Term Counter-Trend Rally
EUR/USD, AUD/USD, GBP/USD and USD/JPY Daily Outlook – September 28, 2017
RBNZ Holds on Rates as Trump Joins the Dollar Rally with Tax Reforms
AUD/USD Forex Technical Analysis – Testing Major Retracement Zone at .7847 to .7782
