
 Yahoo Finance
 Aston Martin Lagonda Global Holdings plc's (LON:AML) P/S Still Appears To Be Reasonable
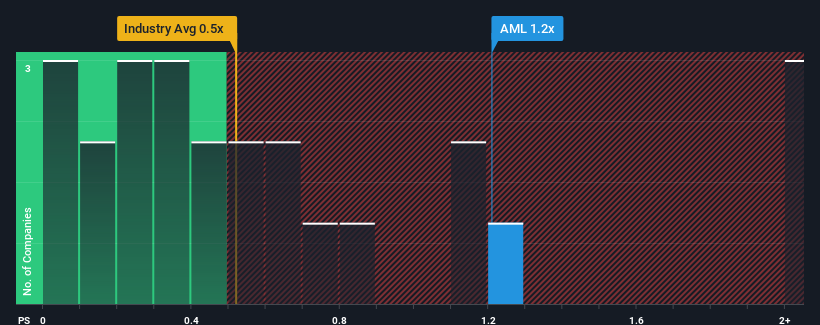
When you see that almost half of the companies in the Auto industry in the United Kingdom have price-to-sales ratios (or "P/S") below 0.5x, Aston Martin Lagonda Global Holdings plc (LON:AML) looks to be giving off some sell signals with its 1.2x P/S ratio. Nonetheless, we'd need to dig a little deeper to determine if there is a rational basis for the elevated P/S.
Check out our latest analysis for Aston Martin Lagonda Global Holdings
How Has Aston Martin Lagonda Global Holdings Performed Recently?
Recent times haven't been great for Aston Martin Lagonda Global Holdings as its revenue has been rising slower than most other companies. One possibility is that the P/S ratio is high because investors think this lacklustre revenue performance will improve markedly. You'd really hope so, otherwise you're paying a pretty hefty price for no particular reason.
Want the full picture on analyst estimates for the company? Then our free report on Aston Martin Lagonda Global Holdings will help you uncover what's on the horizon.
What Are Revenue Growth Metrics Telling Us About The High P/S?
In order to justify its P/S ratio, Aston Martin Lagonda Global Holdings would need to produce impressive growth in excess of the industry.
If we review the last year of revenue growth, the company posted a terrific increase of 26%. The latest three year period has also seen an excellent 41% overall rise in revenue, aided by its short-term performance. Therefore, it's fair to say the revenue growth recently has been superb for the company.
Turning to the outlook, the next three years should generate growth of 14% per year as estimated by the eight analysts watching the company. Meanwhile, the rest of the industry is forecast to only expand by 4.7% per annum, which is noticeably less attractive.
With this in mind, it's not hard to understand why Aston Martin Lagonda Global Holdings' P/S is high relative to its industry peers. It seems most investors are expecting this strong future growth and are willing to pay more for the stock.
The Bottom Line On Aston Martin Lagonda Global Holdings' P/S
Generally, our preference is to limit the use of the price-to-sales ratio to establishing what the market thinks about the overall health of a company.
Our look into Aston Martin Lagonda Global Holdings shows that its P/S ratio remains high on the merit of its strong future revenues. It appears that shareholders are confident in the company's future revenues, which is propping up the P/S. Unless these conditions change, they will continue to provide strong support to the share price.
Before you settle on your opinion, we've discovered 2 warning signs for Aston Martin Lagonda Global Holdings (1 is a bit unpleasant!) that you should be aware of.
If you're unsure about the strength of Aston Martin Lagonda Global Holdings' business, why not explore our interactive list of stocks with solid business fundamentals for some other companies you may have missed.
Have feedback on this article? Concerned about the content? Get in touch with us directly. Alternatively, email editorial-team (at) simplywallst.com.
This article by Simply Wall St is general in nature. We provide commentary based on historical data and analyst forecasts only using an unbiased methodology and our articles are not intended to be financial advice. It does not constitute a recommendation to buy or sell any stock, and does not take account of your objectives, or your financial situation. We aim to bring you long-term focused analysis driven by fundamental data. Note that our analysis may not factor in the latest price-sensitive company announcements or qualitative material. Simply Wall St has no position in any stocks mentioned.
Join A Paid User Research Session
You’ll receive a US$30 Amazon Gift card for 1 hour of your time while helping us build better investing tools for the individual investors like yourself. Sign up here
