
 Yahoo Finance
 ASML Holding's (AMS:ASML) five-year earnings growth trails the massive shareholder returns
Buying shares in the best businesses can build meaningful wealth for you and your family. While not every stock performs well, when investors win, they can win big. Don't believe it? Then look at the ASML Holding N.V. (AMS:ASML) share price. It's 375% higher than it was five years ago. If that doesn't get you thinking about long term investing, we don't know what will. Also pleasing for shareholders was the 15% gain in the last three months. But this could be related to the strong market, which is up 8.0% in the last three months.
Since the stock has added €7.9b to its market cap in the past week alone, let's see if underlying performance has been driving long-term returns.
See our latest analysis for ASML Holding
While the efficient markets hypothesis continues to be taught by some, it has been proven that markets are over-reactive dynamic systems, and investors are not always rational. One flawed but reasonable way to assess how sentiment around a company has changed is to compare the earnings per share (EPS) with the share price.
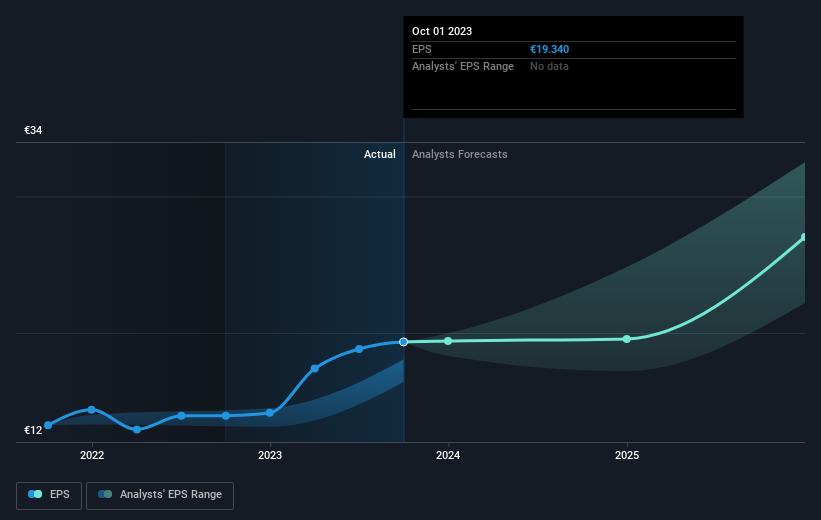
Over half a decade, ASML Holding managed to grow its earnings per share at 28% a year. This EPS growth is slower than the share price growth of 37% per year, over the same period. So it's fair to assume the market has a higher opinion of the business than it did five years ago. And that's hardly shocking given the track record of growth.
You can see below how EPS has changed over time (discover the exact values by clicking on the image).
It is of course excellent to see how ASML Holding has grown profits over the years, but the future is more important for shareholders. It might be well worthwhile taking a look at our free report on how its financial position has changed over time.
What About Dividends?
It is important to consider the total shareholder return, as well as the share price return, for any given stock. The TSR is a return calculation that accounts for the value of cash dividends (assuming that any dividend received was reinvested) and the calculated value of any discounted capital raisings and spin-offs. It's fair to say that the TSR gives a more complete picture for stocks that pay a dividend. In the case of ASML Holding, it has a TSR of 400% for the last 5 years. That exceeds its share price return that we previously mentioned. The dividends paid by the company have thusly boosted the total shareholder return.
A Different Perspective
We're pleased to report that ASML Holding shareholders have received a total shareholder return of 15% over one year. That's including the dividend. However, the TSR over five years, coming in at 38% per year, is even more impressive. Potential buyers might understandably feel they've missed the opportunity, but it's always possible business is still firing on all cylinders. It's always interesting to track share price performance over the longer term. But to understand ASML Holding better, we need to consider many other factors. For instance, we've identified 2 warning signs for ASML Holding (1 makes us a bit uncomfortable) that you should be aware of.
If you would prefer to check out another company -- one with potentially superior financials -- then do not miss this free list of companies that have proven they can grow earnings.
Please note, the market returns quoted in this article reflect the market weighted average returns of stocks that currently trade on Dutch exchanges.
Have feedback on this article? Concerned about the content? Get in touch with us directly. Alternatively, email editorial-team (at) simplywallst.com.
This article by Simply Wall St is general in nature. We provide commentary based on historical data and analyst forecasts only using an unbiased methodology and our articles are not intended to be financial advice. It does not constitute a recommendation to buy or sell any stock, and does not take account of your objectives, or your financial situation. We aim to bring you long-term focused analysis driven by fundamental data. Note that our analysis may not factor in the latest price-sensitive company announcements or qualitative material. Simply Wall St has no position in any stocks mentioned.
