
 Yahoo Finance
 Asbury Automotive Group (NYSE:ABG) sheds 3.5% this week, as yearly returns fall more in line with earnings growth
It might be of some concern to shareholders to see the Asbury Automotive Group, Inc. (NYSE:ABG) share price down 11% in the last month. But in stark contrast, the returns over the last half decade have impressed. It's fair to say most would be happy with 214% the gain in that time. We think it's more important to dwell on the long term returns than the short term returns. The more important question is whether the stock is too cheap or too expensive today.
Since the long term performance has been good but there's been a recent pullback of 3.5%, let's check if the fundamentals match the share price.
See our latest analysis for Asbury Automotive Group
While the efficient markets hypothesis continues to be taught by some, it has been proven that markets are over-reactive dynamic systems, and investors are not always rational. One flawed but reasonable way to assess how sentiment around a company has changed is to compare the earnings per share (EPS) with the share price.
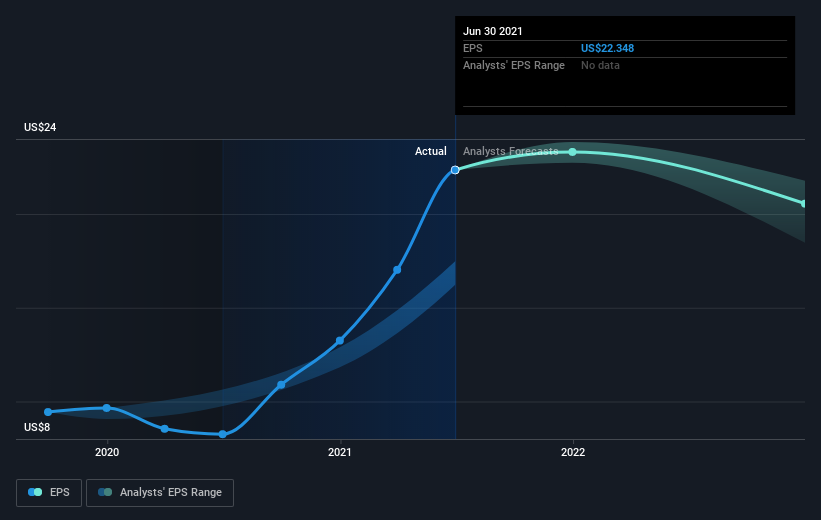
Over half a decade, Asbury Automotive Group managed to grow its earnings per share at 28% a year. This EPS growth is reasonably close to the 26% average annual increase in the share price. Therefore one could conclude that sentiment towards the shares hasn't morphed very much. In fact, the share price seems to largely reflect the EPS growth.
You can see how EPS has changed over time in the image below (click on the chart to see the exact values).
It is of course excellent to see how Asbury Automotive Group has grown profits over the years, but the future is more important for shareholders. Take a more thorough look at Asbury Automotive Group's financial health with this free report on its balance sheet.
A Different Perspective
It's nice to see that Asbury Automotive Group shareholders have received a total shareholder return of 62% over the last year. Since the one-year TSR is better than the five-year TSR (the latter coming in at 26% per year), it would seem that the stock's performance has improved in recent times. In the best case scenario, this may hint at some real business momentum, implying that now could be a great time to delve deeper. I find it very interesting to look at share price over the long term as a proxy for business performance. But to truly gain insight, we need to consider other information, too. For instance, we've identified 2 warning signs for Asbury Automotive Group (1 is potentially serious) that you should be aware of.
Of course, you might find a fantastic investment by looking elsewhere. So take a peek at this free list of companies we expect will grow earnings.
Please note, the market returns quoted in this article reflect the market weighted average returns of stocks that currently trade on US exchanges.
This article by Simply Wall St is general in nature. We provide commentary based on historical data and analyst forecasts only using an unbiased methodology and our articles are not intended to be financial advice. It does not constitute a recommendation to buy or sell any stock, and does not take account of your objectives, or your financial situation. We aim to bring you long-term focused analysis driven by fundamental data. Note that our analysis may not factor in the latest price-sensitive company announcements or qualitative material. Simply Wall St has no position in any stocks mentioned.
Have feedback on this article? Concerned about the content? Get in touch with us directly. Alternatively, email editorial-team (at) simplywallst.com.
