
 Yahoo Finance
 Asbestos' (CVE:AB.H) Returns On Capital Tell Us There Is Reason To Feel Uneasy
When it comes to investing, there are some useful financial metrics that can warn us when a business is potentially in trouble. A business that's potentially in decline often shows two trends, a return on capital employed (ROCE) that's declining, and a base of capital employed that's also declining. Ultimately this means that the company is earning less per dollar invested and on top of that, it's shrinking its base of capital employed. On that note, looking into Asbestos (CVE:AB.H), we weren't too upbeat about how things were going.
Understanding Return On Capital Employed (ROCE)
If you haven't worked with ROCE before, it measures the 'return' (pre-tax profit) a company generates from capital employed in its business. To calculate this metric for Asbestos, this is the formula:
Return on Capital Employed = Earnings Before Interest and Tax (EBIT) ÷ (Total Assets - Current Liabilities)
0.051 = CA$1.4m ÷ (CA$32m - CA$4.4m) (Based on the trailing twelve months to June 2023).
Therefore, Asbestos has an ROCE of 5.1%. In absolute terms, that's a low return, but it's much better than the Metals and Mining industry average of 3.7%.
View our latest analysis for Asbestos
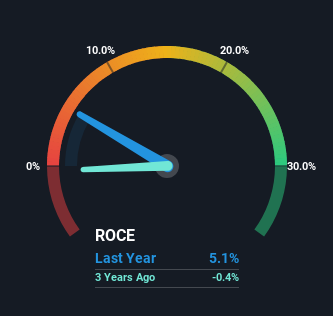
Historical performance is a great place to start when researching a stock so above you can see the gauge for Asbestos' ROCE against it's prior returns. If you'd like to look at how Asbestos has performed in the past in other metrics, you can view this free graph of past earnings, revenue and cash flow.
What The Trend Of ROCE Can Tell Us
We are a bit worried about the trend of returns on capital at Asbestos. Unfortunately the returns on capital have diminished from the 6.7% that they were earning five years ago. On top of that, it's worth noting that the amount of capital employed within the business has remained relatively steady. This combination can be indicative of a mature business that still has areas to deploy capital, but the returns received aren't as high due potentially to new competition or smaller margins. If these trends continue, we wouldn't expect Asbestos to turn into a multi-bagger.
Our Take On Asbestos' ROCE
In the end, the trend of lower returns on the same amount of capital isn't typically an indication that we're looking at a growth stock. Yet despite these poor fundamentals, the stock has gained a huge 129% over the last five years, so investors appear very optimistic. In any case, the current underlying trends don't bode well for long term performance so unless they reverse, we'd start looking elsewhere.
If you want to know some of the risks facing Asbestos we've found 6 warning signs (5 can't be ignored!) that you should be aware of before investing here.
While Asbestos may not currently earn the highest returns, we've compiled a list of companies that currently earn more than 25% return on equity. Check out this free list here.
Have feedback on this article? Concerned about the content? Get in touch with us directly. Alternatively, email editorial-team (at) simplywallst.com.
This article by Simply Wall St is general in nature. We provide commentary based on historical data and analyst forecasts only using an unbiased methodology and our articles are not intended to be financial advice. It does not constitute a recommendation to buy or sell any stock, and does not take account of your objectives, or your financial situation. We aim to bring you long-term focused analysis driven by fundamental data. Note that our analysis may not factor in the latest price-sensitive company announcements or qualitative material. Simply Wall St has no position in any stocks mentioned.
