
 Yahoo Finance
 Asbestos (CVE:AB.H) Is Experiencing Growth In Returns On Capital
Finding a business that has the potential to grow substantially is not easy, but it is possible if we look at a few key financial metrics. In a perfect world, we'd like to see a company investing more capital into its business and ideally the returns earned from that capital are also increasing. Put simply, these types of businesses are compounding machines, meaning they are continually reinvesting their earnings at ever-higher rates of return. With that in mind, we've noticed some promising trends at Asbestos (CVE:AB.H) so let's look a bit deeper.
What Is Return On Capital Employed (ROCE)?
For those who don't know, ROCE is a measure of a company's yearly pre-tax profit (its return), relative to the capital employed in the business. Analysts use this formula to calculate it for Asbestos:
Return on Capital Employed = Earnings Before Interest and Tax (EBIT) ÷ (Total Assets - Current Liabilities)
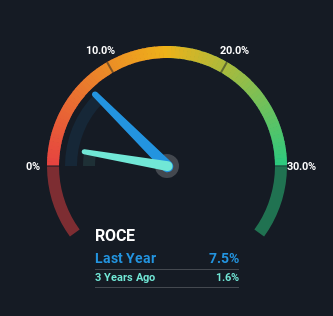
0.075 = CA$2.4m ÷ (CA$36m - CA$4.3m) (Based on the trailing twelve months to December 2023).
Thus, Asbestos has an ROCE of 7.5%. In absolute terms, that's a low return, but it's much better than the Metals and Mining industry average of 1.9%.
Check out our latest analysis for Asbestos
While the past is not representative of the future, it can be helpful to know how a company has performed historically, which is why we have this chart above. If you want to delve into the historical earnings , check out these free graphs detailing revenue and cash flow performance of Asbestos.
What Does the ROCE Trend For Asbestos Tell Us?
Even though ROCE is still low in absolute terms, it's good to see it's heading in the right direction. The data shows that returns on capital have increased substantially over the last five years to 7.5%. The company is effectively making more money per dollar of capital used, and it's worth noting that the amount of capital has increased too, by 24%. This can indicate that there's plenty of opportunities to invest capital internally and at ever higher rates, a combination that's common among multi-baggers.
The Bottom Line On Asbestos' ROCE
To sum it up, Asbestos has proven it can reinvest in the business and generate higher returns on that capital employed, which is terrific. And with a respectable 82% awarded to those who held the stock over the last five years, you could argue that these developments are starting to get the attention they deserve. With that being said, we still think the promising fundamentals mean the company deserves some further due diligence.
Asbestos does have some risks, we noticed 6 warning signs (and 4 which are concerning) we think you should know about.
While Asbestos isn't earning the highest return, check out this free list of companies that are earning high returns on equity with solid balance sheets.
Have feedback on this article? Concerned about the content? Get in touch with us directly. Alternatively, email editorial-team (at) simplywallst.com.
This article by Simply Wall St is general in nature. We provide commentary based on historical data and analyst forecasts only using an unbiased methodology and our articles are not intended to be financial advice. It does not constitute a recommendation to buy or sell any stock, and does not take account of your objectives, or your financial situation. We aim to bring you long-term focused analysis driven by fundamental data. Note that our analysis may not factor in the latest price-sensitive company announcements or qualitative material. Simply Wall St has no position in any stocks mentioned.
