
 Yahoo Finance
 When Will Ardelyx, Inc. (NASDAQ:ARDX) Become Profitable?
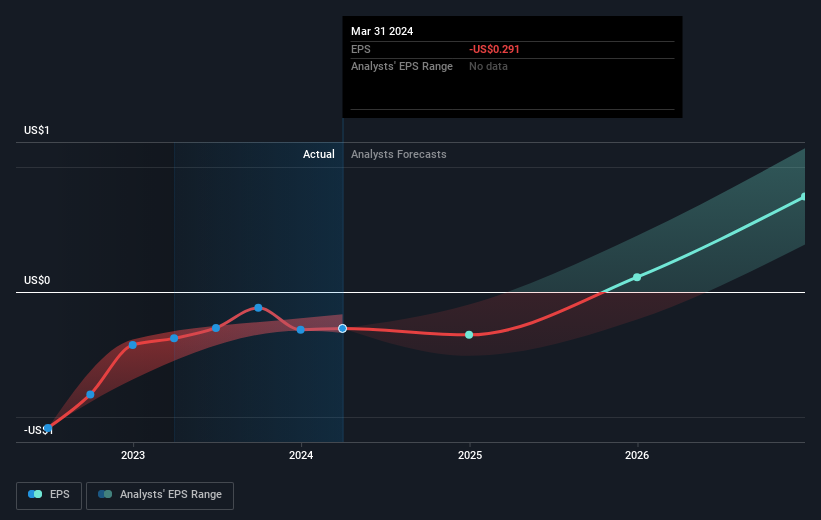
With the business potentially at an important milestone, we thought we'd take a closer look at Ardelyx, Inc.'s (NASDAQ:ARDX) future prospects. Ardelyx, Inc., a biopharmaceutical company, discovers, develops, and commercializes medicines to treat gastrointestinal and cardiorenal therapeutic areas in the United States and internationally. The US$1.4b market-cap company posted a loss in its most recent financial year of US$66m and a latest trailing-twelve-month loss of US$66m shrinking the gap between loss and breakeven. The most pressing concern for investors is Ardelyx's path to profitability – when will it breakeven? In this article, we will touch on the expectations for the company's growth and when analysts expect it to become profitable.
See our latest analysis for Ardelyx
Consensus from 10 of the American Biotechs analysts is that Ardelyx is on the verge of breakeven. They anticipate the company to incur a final loss in 2024, before generating positive profits of US$29m in 2025. The company is therefore projected to breakeven just over a year from now. In order to meet this breakeven date, we calculated the rate at which the company must grow year-on-year. It turns out an average annual growth rate of 61% is expected, which signals high confidence from analysts. Should the business grow at a slower rate, it will become profitable at a later date than expected.
We're not going to go through company-specific developments for Ardelyx given that this is a high-level summary, but, take into account that generally biotechs, depending on the stage of product development, have irregular periods of cash flow. This means that a high growth rate is not unusual, especially if the company is currently in an investment period.
One thing we would like to bring into light with Ardelyx is its relatively high level of debt. Generally, the rule of thumb is debt shouldn’t exceed 40% of your equity, which in Ardelyx's case is 81%. A higher level of debt requires more stringent capital management which increases the risk in investing in the loss-making company.
Next Steps:
There are key fundamentals of Ardelyx which are not covered in this article, but we must stress again that this is merely a basic overview. For a more comprehensive look at Ardelyx, take a look at Ardelyx's company page on Simply Wall St. We've also put together a list of key factors you should look at:
Valuation: What is Ardelyx worth today? Has the future growth potential already been factored into the price? The intrinsic value infographic in our free research report helps visualize whether Ardelyx is currently mispriced by the market.
Management Team: An experienced management team on the helm increases our confidence in the business – take a look at who sits on Ardelyx’s board and the CEO’s background.
Other High-Performing Stocks: Are there other stocks that provide better prospects with proven track records? Explore our free list of these great stocks here.
Have feedback on this article? Concerned about the content? Get in touch with us directly. Alternatively, email editorial-team (at) simplywallst.com.
This article by Simply Wall St is general in nature. We provide commentary based on historical data and analyst forecasts only using an unbiased methodology and our articles are not intended to be financial advice. It does not constitute a recommendation to buy or sell any stock, and does not take account of your objectives, or your financial situation. We aim to bring you long-term focused analysis driven by fundamental data. Note that our analysis may not factor in the latest price-sensitive company announcements or qualitative material. Simply Wall St has no position in any stocks mentioned.
Have feedback on this article? Concerned about the content? Get in touch with us directly. Alternatively, email editorial-team@simplywallst.com
