
 Yahoo Finance
 Is Apergy Corporation's (NYSE:APY) Balance Sheet A Threat To Its Future?

Want to participate in a short research study? Help shape the future of investing tools and you could win a $250 gift card!
Investors are always looking for growth in small-cap stocks like Apergy Corporation (NYSE:APY), with a market cap of US$2.5b. However, an important fact which most ignore is: how financially healthy is the business? Assessing first and foremost the financial health is essential, as mismanagement of capital can lead to bankruptcies, which occur at a higher rate for small-caps. We'll look at some basic checks that can form a snapshot the company’s financial strength. However, this is just a partial view of the stock, and I recommend you dig deeper yourself into APY here.
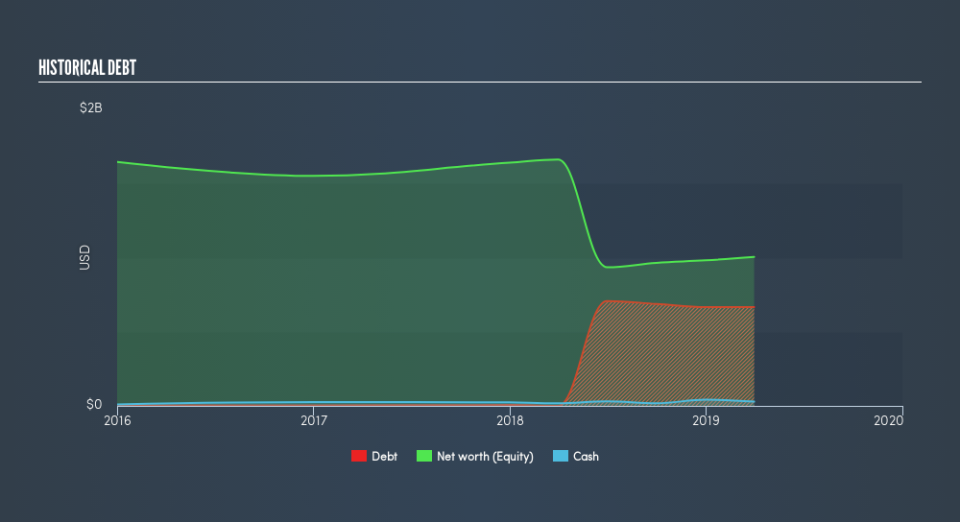
Does APY Produce Much Cash Relative To Its Debt?
In the previous 12 months, APY's rose by about US$666m including long-term debt. With this increase in debt, APY currently has US$28m remaining in cash and short-term investments to keep the business going. Moreover, APY has produced US$176m in operating cash flow in the last twelve months, leading to an operating cash to total debt ratio of 26%, indicating that APY’s debt is appropriately covered by operating cash.
Can APY meet its short-term obligations with the cash in hand?
With current liabilities at US$212m, it seems that the business has been able to meet these obligations given the level of current assets of US$538m, with a current ratio of 2.53x. The current ratio is the number you get when you divide current assets by current liabilities. Usually, for Energy Services companies, this is a suitable ratio as there's enough of a cash buffer without holding too much capital in low return investments.
Can APY service its debt comfortably?
APY is a relatively highly levered company with a debt-to-equity of 66%. This is a bit unusual for a small-cap stock, since they generally have a harder time borrowing than large more established companies. We can test if APY’s debt levels are sustainable by measuring interest payments against earnings of a company. Ideally, earnings before interest and tax (EBIT) should cover net interest by at least three times. For APY, the ratio of 4.78x suggests that interest is appropriately covered, which means that lenders may be inclined to lend more money to the company, as it is seen as safe in terms of payback.
Next Steps:
Although APY’s debt level is towards the higher end of the spectrum, its cash flow coverage seems adequate to meet obligations which means its debt is being efficiently utilised. This may mean this is an optimal capital structure for the business, given that it is also meeting its short-term commitment. I admit this is a fairly basic analysis for APY's financial health. Other important fundamentals need to be considered alongside. I recommend you continue to research Apergy to get a more holistic view of the small-cap by looking at:
Future Outlook: What are well-informed industry analysts predicting for APY’s future growth? Take a look at our free research report of analyst consensus for APY’s outlook.
Valuation: What is APY worth today? Is the stock undervalued, even when its growth outlook is factored into its intrinsic value? The intrinsic value infographic in our free research report helps visualize whether APY is currently mispriced by the market.
Other High-Performing Stocks: Are there other stocks that provide better prospects with proven track records? Explore our free list of these great stocks here.
We aim to bring you long-term focused research analysis driven by fundamental data. Note that our analysis may not factor in the latest price-sensitive company announcements or qualitative material.
If you spot an error that warrants correction, please contact the editor at editorial-team@simplywallst.com. This article by Simply Wall St is general in nature. It does not constitute a recommendation to buy or sell any stock, and does not take account of your objectives, or your financial situation. Simply Wall St has no position in the stocks mentioned. Thank you for reading.
