
 Yahoo Finance
 Analysts Expect Compass Diversified (NYSE:CODI) To Breakeven Soon
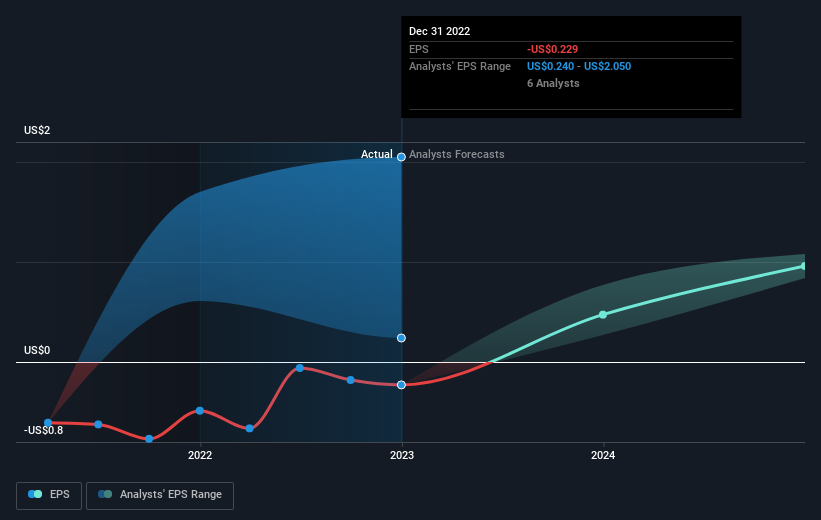
We feel now is a pretty good time to analyse Compass Diversified's (NYSE:CODI) business as it appears the company may be on the cusp of a considerable accomplishment. Compass Diversified is a private equity firm specializing in add on acquisitions, buyouts, industry consolidation, recapitalization, late stage and middle market investments. On 31 December 2022, the US$1.4b market-cap company posted a loss of US$16m for its most recent financial year. The most pressing concern for investors is Compass Diversified's path to profitability – when will it breakeven? In this article, we will touch on the expectations for the company's growth and when analysts expect it to become profitable.
See our latest analysis for Compass Diversified
According to the 6 industry analysts covering Compass Diversified, the consensus is that breakeven is near. They anticipate the company to incur a final loss in 2022, before generating positive profits of US$90m in 2023. So, the company is predicted to breakeven approximately 12 months from now or less. At what rate will the company have to grow in order to realise the consensus estimates forecasting breakeven in under 12 months? Using a line of best fit, we calculated an average annual growth rate of 89%, which is extremely buoyant. If this rate turns out to be too aggressive, the company may become profitable much later than analysts predict.
Given this is a high-level overview, we won’t go into details of Compass Diversified's upcoming projects, but, keep in mind that typically a high growth rate is not out of the ordinary, particularly when a company is in a period of investment.
One thing we would like to bring into light with Compass Diversified is its debt-to-equity ratio of 135%. Generally, the rule of thumb is debt shouldn’t exceed 40% of your equity, and the company has considerably exceeded this. A higher level of debt requires more stringent capital management which increases the risk around investing in the loss-making company.
Next Steps:
There are key fundamentals of Compass Diversified which are not covered in this article, but we must stress again that this is merely a basic overview. For a more comprehensive look at Compass Diversified, take a look at Compass Diversified's company page on Simply Wall St. We've also put together a list of important aspects you should further examine:
Historical Track Record: What has Compass Diversified's performance been like over the past? Go into more detail in the past track record analysis and take a look at the free visual representations of our analysis for more clarity.
Management Team: An experienced management team on the helm increases our confidence in the business – take a look at who sits on Compass Diversified's board and the CEO’s background.
Other High-Performing Stocks: Are there other stocks that provide better prospects with proven track records? Explore our free list of these great stocks here.
Have feedback on this article? Concerned about the content? Get in touch with us directly. Alternatively, email editorial-team (at) simplywallst.com.
This article by Simply Wall St is general in nature. We provide commentary based on historical data and analyst forecasts only using an unbiased methodology and our articles are not intended to be financial advice. It does not constitute a recommendation to buy or sell any stock, and does not take account of your objectives, or your financial situation. We aim to bring you long-term focused analysis driven by fundamental data. Note that our analysis may not factor in the latest price-sensitive company announcements or qualitative material. Simply Wall St has no position in any stocks mentioned.
Join A Paid User Research Session
You’ll receive a US$30 Amazon Gift card for 1 hour of your time while helping us build better investing tools for the individual investors like yourself. Sign up here
