
 Yahoo Finance
 ams-OSRAM (VTX:AMS) Might Have The Makings Of A Multi-Bagger
If we want to find a stock that could multiply over the long term, what are the underlying trends we should look for? One common approach is to try and find a company with returns on capital employed (ROCE) that are increasing, in conjunction with a growing amount of capital employed. Ultimately, this demonstrates that it's a business that is reinvesting profits at increasing rates of return. So when we looked at ams-OSRAM (VTX:AMS) and its trend of ROCE, we really liked what we saw.
What Is Return On Capital Employed (ROCE)?
Just to clarify if you're unsure, ROCE is a metric for evaluating how much pre-tax income (in percentage terms) a company earns on the capital invested in its business. The formula for this calculation on ams-OSRAM is:
Return on Capital Employed = Earnings Before Interest and Tax (EBIT) ÷ (Total Assets - Current Liabilities)
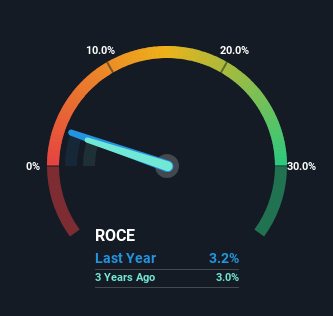
0.032 = €123m ÷ (€6.9b - €3.1b) (Based on the trailing twelve months to March 2024).
Therefore, ams-OSRAM has an ROCE of 3.2%. In absolute terms, that's a low return and it also under-performs the Semiconductor industry average of 15%.
View our latest analysis for ams-OSRAM
Above you can see how the current ROCE for ams-OSRAM compares to its prior returns on capital, but there's only so much you can tell from the past. If you'd like, you can check out the forecasts from the analysts covering ams-OSRAM for free.
What The Trend Of ROCE Can Tell Us
ams-OSRAM has recently broken into profitability so their prior investments seem to be paying off. Shareholders would no doubt be pleased with this because the business was loss-making five years ago but is is now generating 3.2% on its capital. In addition to that, ams-OSRAM is employing 24% more capital than previously which is expected of a company that's trying to break into profitability. We like this trend, because it tells us the company has profitable reinvestment opportunities available to it, and if it continues going forward that can lead to a multi-bagger performance.
For the record though, there was a noticeable increase in the company's current liabilities over the period, so we would attribute some of the ROCE growth to that. Effectively this means that suppliers or short-term creditors are now funding 44% of the business, which is more than it was five years ago. And with current liabilities at those levels, that's pretty high.
What We Can Learn From ams-OSRAM's ROCE
To the delight of most shareholders, ams-OSRAM has now broken into profitability. However the stock is down a substantial 93% in the last five years so there could be other areas of the business hurting its prospects. Regardless, we think the underlying fundamentals warrant this stock for further investigation.
On a separate note, we've found 2 warning signs for ams-OSRAM you'll probably want to know about.
While ams-OSRAM may not currently earn the highest returns, we've compiled a list of companies that currently earn more than 25% return on equity. Check out this free list here.
Have feedback on this article? Concerned about the content? Get in touch with us directly. Alternatively, email editorial-team (at) simplywallst.com.
This article by Simply Wall St is general in nature. We provide commentary based on historical data and analyst forecasts only using an unbiased methodology and our articles are not intended to be financial advice. It does not constitute a recommendation to buy or sell any stock, and does not take account of your objectives, or your financial situation. We aim to bring you long-term focused analysis driven by fundamental data. Note that our analysis may not factor in the latest price-sensitive company announcements or qualitative material. Simply Wall St has no position in any stocks mentioned.
