
 Yahoo Finance
 Can Amphenol Corporation (NYSE:APH) Maintain Its Strong Returns?

Many investors are still learning about the various metrics that can be useful when analysing a stock. This article is for those who would like to learn about Return On Equity (ROE). By way of learning-by-doing, we’ll look at ROE to gain a better understanding of Amphenol Corporation (NYSE:APH).
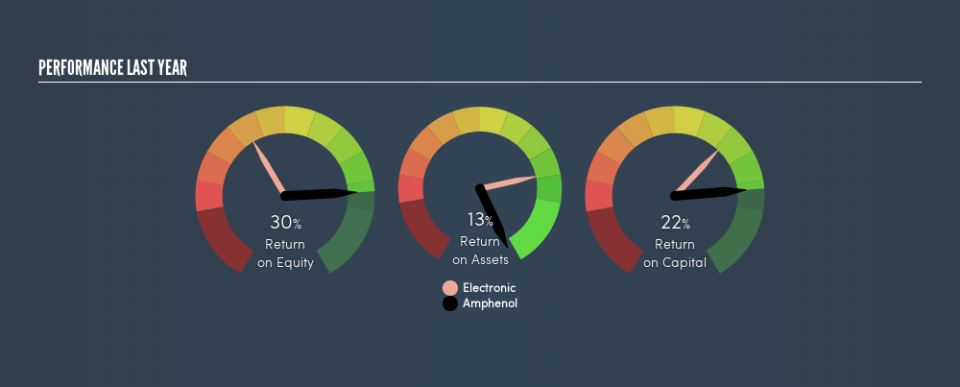
Amphenol has a ROE of 30%, based on the last twelve months. Another way to think of that is that for every $1 worth of equity in the company, it was able to earn $0.30.
See our latest analysis for Amphenol
How Do I Calculate Return On Equity?
The formula for return on equity is:
Return on Equity = Net Profit ÷ Shareholders’ Equity
Or for Amphenol:
30% = 1205 ÷ US$4.1b (Based on the trailing twelve months to December 2018.)
It’s easy to understand the ‘net profit’ part of that equation, but ‘shareholders’ equity’ requires further explanation. It is the capital paid in by shareholders, plus any retained earnings. You can calculate shareholders’ equity by subtracting the company’s total liabilities from its total assets.
What Does Return On Equity Signify?
ROE measures a company’s profitability against the profit it retains, and any outside investments. The ‘return’ is the yearly profit. That means that the higher the ROE, the more profitable the company is. So, all else equal, investors should like a high ROE. That means it can be interesting to compare the ROE of different companies.
Does Amphenol Have A Good Return On Equity?
Arguably the easiest way to assess company’s ROE is to compare it with the average in its industry. However, this method is only useful as a rough check, because companies do differ quite a bit within the same industry classification. As you can see in the graphic below, Amphenol has a higher ROE than the average (11%) in the Electronic industry.
That’s clearly a positive. We think a high ROE, alone, is usually enough to justify further research into a company. One data point to check is if insiders have bought shares recently.
Why You Should Consider Debt When Looking At ROE
Companies usually need to invest money to grow their profits. That cash can come from issuing shares, retained earnings, or debt. In the first two cases, the ROE will capture this use of capital to grow. In the latter case, the debt used for growth will improve returns, but won’t affect the total equity. That will make the ROE look better than if no debt was used.
Combining Amphenol’s Debt And Its 30% Return On Equity
Amphenol has a debt to equity ratio of 0.88, which is far from excessive. The combination of modest debt and a very impressive ROE does suggest that the business is high quality. Careful use of debt to boost returns is often very good for shareholders. However, it could reduce the company’s ability to take advantage of future opportunities.
But It’s Just One Metric
Return on equity is useful for comparing the quality of different businesses. Companies that can achieve high returns on equity without too much debt are generally of good quality. If two companies have the same ROE, then I would generally prefer the one with less debt.
But when a business is high quality, the market often bids it up to a price that reflects this. The rate at which profits are likely to grow, relative to the expectations of profit growth reflected in the current price, must be considered, too. So I think it may be worth checking this free report on analyst forecasts for the company.
Of course, you might find a fantastic investment by looking elsewhere. So take a peek at this free list of interesting companies.
We aim to bring you long-term focused research analysis driven by fundamental data. Note that our analysis may not factor in the latest price-sensitive company announcements or qualitative material.
If you spot an error that warrants correction, please contact the editor at editorial-team@simplywallst.com. This article by Simply Wall St is general in nature. It does not constitute a recommendation to buy or sell any stock, and does not take account of your objectives, or your financial situation. Simply Wall St has no position in the stocks mentioned. Thank you for reading.
