
 Yahoo Finance
 America’s Middle Class Is Growing the Most in These 50 Cities
Disregard any speculation you might have heard about the middle class fading into obscurity. Across 50 cities in the United States, the middle class is not only thriving but there’s active growth in the population.
Read Next: How Far a $100,000 Salary Goes in America’s 50 Largest Cities
Learn More: 6 Genius Things All Wealthy People Do With Their Money
To find the cities where the middle class has grown the most, GOBankingRates looked at all U.S. cities with above 40,000 households. Each city’s households in 2022 were analyzed to find the percentage that would be considered middle class, or earning between $50,000 to $149,999.
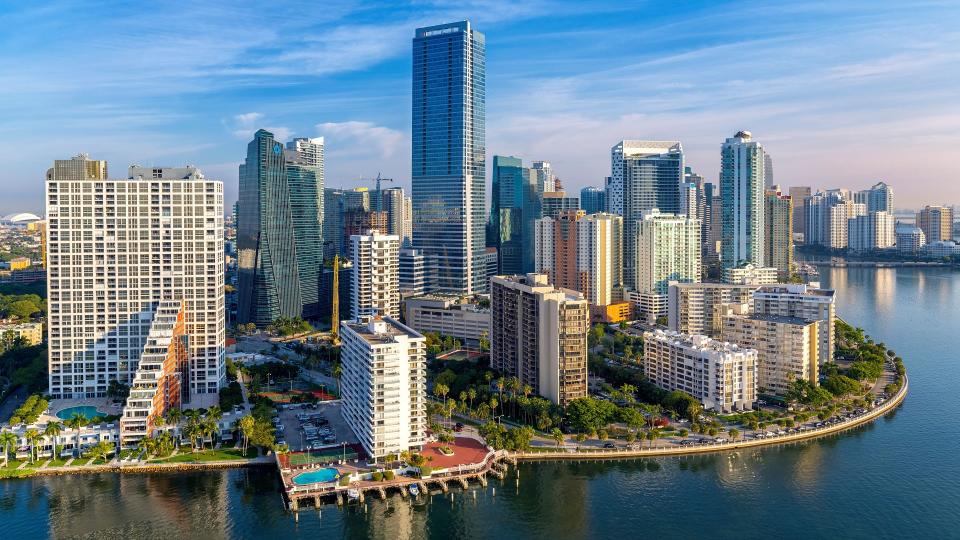
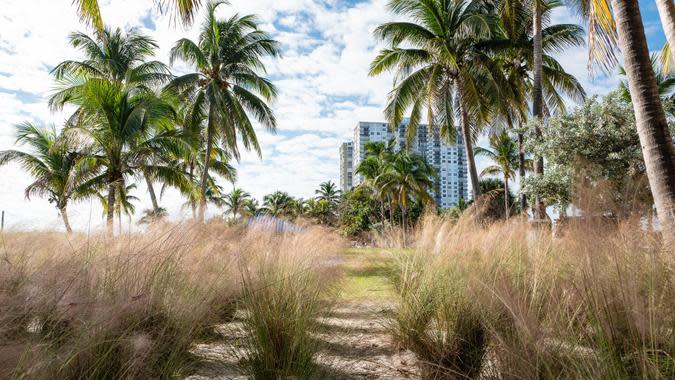
These cities were then ranked on a five-year change in percentage of middle-class households from 2017 to 2022, and the 50 cities with the greatest changes were included in the final rankings. Only one state is mentioned three times in the top 10 cities. That is Florida, where Hialeah, Miami and Palm Bay all saw significant middle-class growth.
Ranked from 50 to 1, here are the 50 U.S. cities experiencing a growing middle class population.

50. Chattanooga, Tennessee
2022 total households: 77,016
2017 percent of households made up of the middle class: 36.1%
2022 percent of households made up of the middle class: 42.7%
5-year change in middle-class households: 18.28%
Explore More: Net Worth Floridians: How Much to Be Poor, Middle-Class, or Rich in Florida
Find Out: Here’s What the US Minimum Wage Was the Year You Were Born
Sponsored: Owe the IRS $10K or more? Schedule a FREE consultation to see if you qualify for tax relief.

49. Dallas, Texas
2022 total households: 521,147
2017 percent of households made up of the middle class: 36.5%
2022 percent of households made up of the middle class: 43.2%
5-year change in middle-class households: 18.36%
For You: I’m a Real Estate Agent: 5 Cities Where Homes Will Be the Best Bargains in 2024
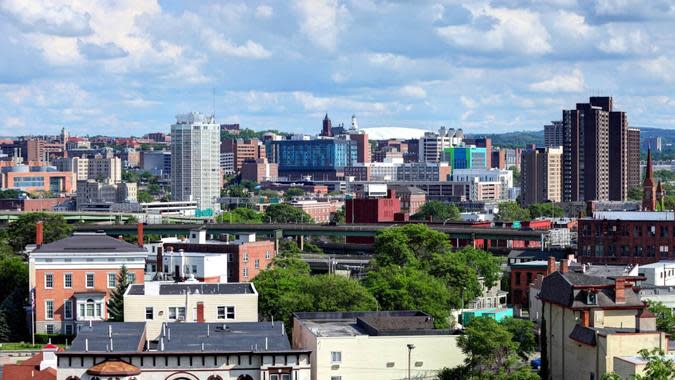
48. Syracuse, New York
2022 total households: 58,424
2017 percent of households made up of the middle class: 31.2%
2022 percent of households made up of the middle class: 37.1%
5-year change in middle-class households: 18.91%
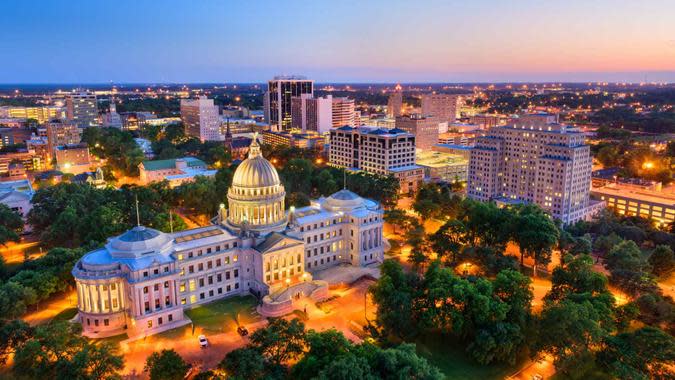
47. Jackson, Mississippi
2022 total households: 62,053
2017 percent of households made up of the middle class: 31.1%
2022 percent of households made up of the middle class: 37.0%
5-year change in middle-class households: 18.97%
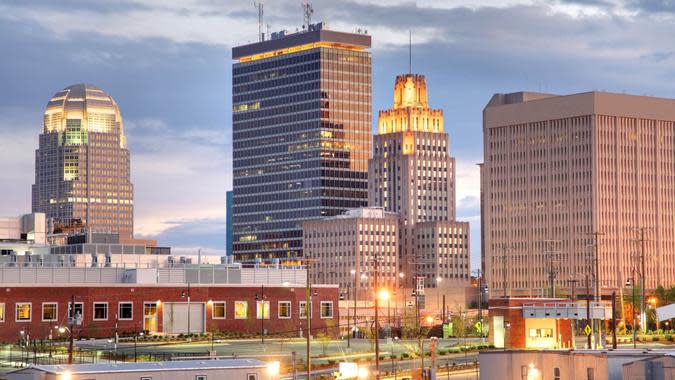
46. Winston-Salem, North Carolina
2022 total households: 98,749
2017 percent of households made up of the middle class: 35.7%
2022 percent of households made up of the middle class: 42.5%
5-year change in middle-class households: 19.05%
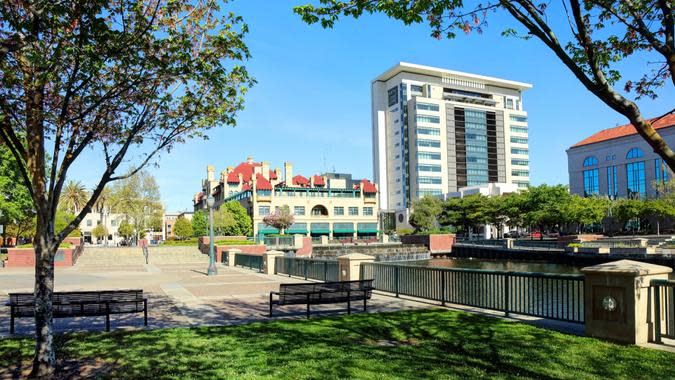
45. Stockton, California
2022 total households: 96,975
2017 percent of households made up of the middle class: 40.8%
2022 percent of households made up of the middle class: 48.6%
5-year change in middle-class households: 19.12%

44. Sunrise Manor, Nevada
2022 total households: 64,271
2017 percent of households made up of the middle class: 38.1%
2022 percent of households made up of the middle class: 45.4%
5-year change in middle-class households: 19.16%
Discover More: Net Worth for Baby Boomers: How To Tell Whether You’re Poor, Middle Class, Upper Middle Class or Rich
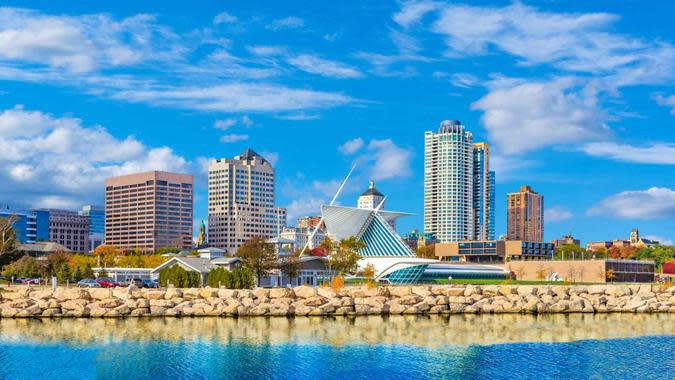
43. Milwaukee, Wisconsin
2022 total households: 230,759
2017 percent of households made up of the middle class: 35.4%
2022 percent of households made up of the middle class: 42.2%
5-year change in middle-class households: 19.21%

42. Augusta, Georgia
2022 total households: 72,510
2017 percent of households made up of the middle class: 35.1%
2022 percent of households made up of the middle class: 41.9%
5-year change in middle-class households: 19.37%

41. Spokane Valley, Washington
2022 total households: 41,984
2017 percent of households made up of the middle class: 43.6%
2022 percent of households made up of the middle class: 52.2%
5-year change in middle-class households: 19.72%
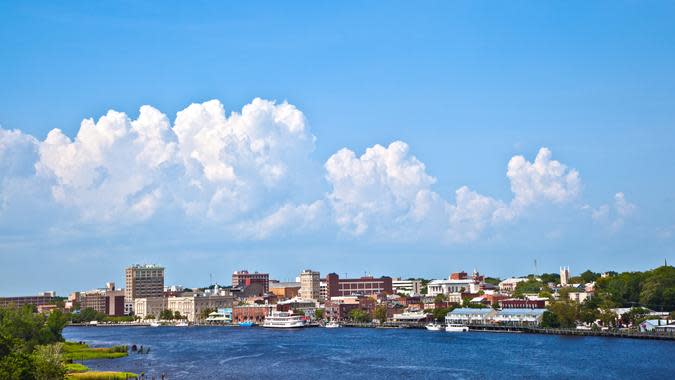
40. Wilmington, North Carolina
2022 total households: 53,374
2017 percent of households made up of the middle class: 36.2%
2022 percent of households made up of the middle class: 43.7%
5-year change in middle-class households: 20.72%
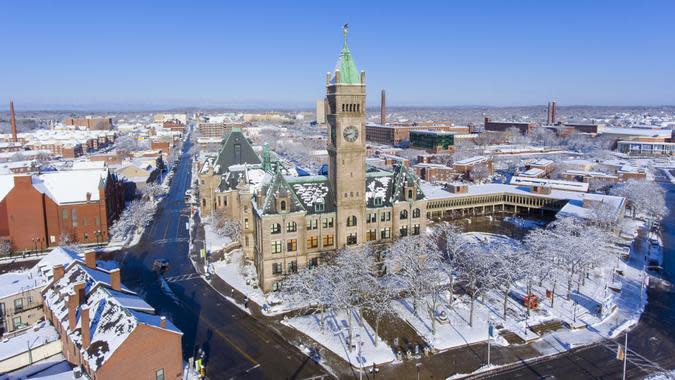
39. Lowell, Massachusetts
2022 total households: 42,343
2017 percent of households made up of the middle class: 41.3%
2022 percent of households made up of the middle class: 49.9%
5-year change in middle-class households: 20.82%
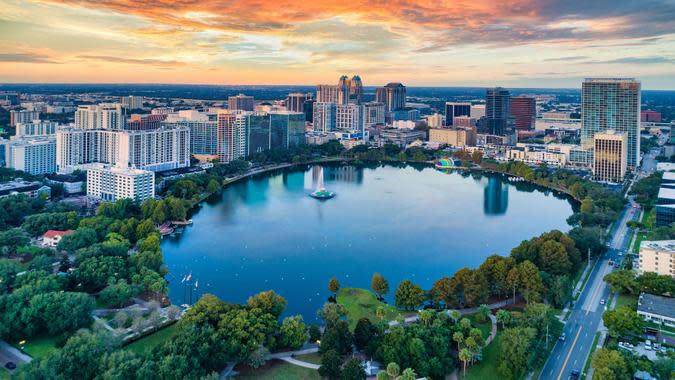
38. Orlando, Florida
2022 total households: 122,607
2017 percent of households made up of the middle class: 37.3%
2022 percent of households made up of the middle class: 45.1%
5-year change in middle-class households: 20.91%
Find Out: Why Florida’s Retirees Are Fleeing — And Where They’re Going Instead
37. Brownsville, Texas
2022 total households: 56,876
2017 percent of households made up of the middle class: 33.4%
2022 percent of households made up of the middle class: 40.5%
5-year change in middle-class households: 21.26%
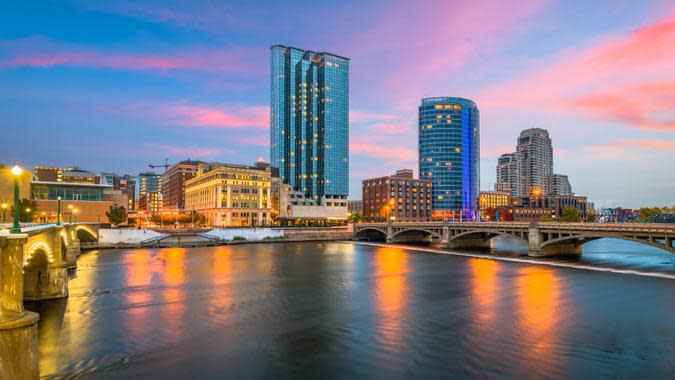
36. Grand Rapids, Michigan
2022 total households: 79,009
2017 percent of households made up of the middle class: 40.1%
2022 percent of households made up of the middle class: 48.8%
5-year change in middle-class households: 21.70%

35. Spokane, Washington
2022 total households: 96,007
2017 percent of households made up of the middle class: 39.3%
2022 percent of households made up of the middle class: 47.9%
5-year change in middle-class households: 21.88%
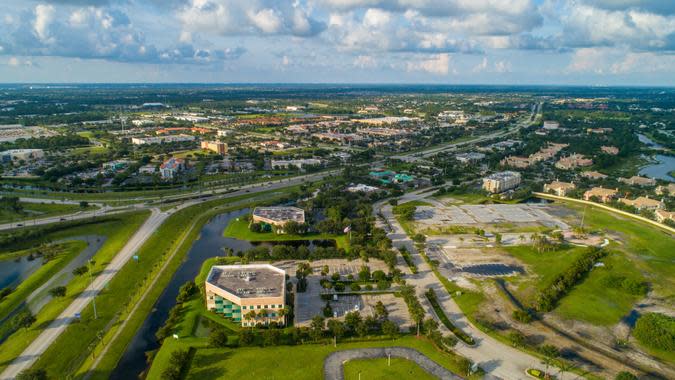
34. Port St. Lucie, Florida
2022 total households: 74,960
2017 percent of households made up of the middle class: 47.5%
2022 percent of households made up of the middle class: 57.9%
5-year change in middle-class households: 21.89%

33. South Bend, Indiana
2022 total households: 40,559
2017 percent of households made up of the middle class: 34.2%
2022 percent of households made up of the middle class: 41.8%
5-year change in middle-class households: 22.22%
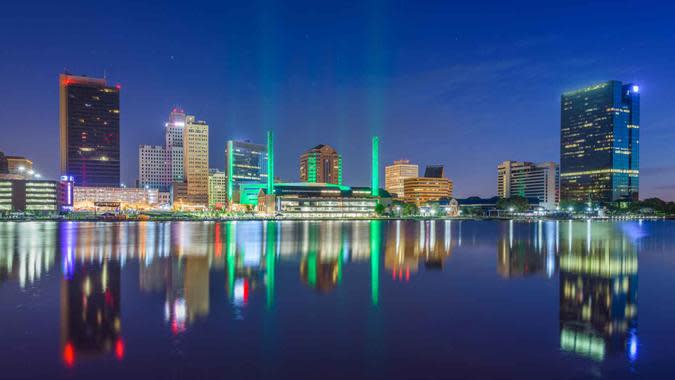
32. Toledo, Ohio
2022 total households: 117,618
2017 percent of households made up of the middle class: 33.4%
2022 percent of households made up of the middle class: 40.9%
5-year change in middle-class households: 22.46%
31. Springfield, Missouri
2022 total households: 79,070
2017 percent of households made up of the middle class: 30.7%
2022 percent of households made up of the middle class: 37.6%
5-year change in middle-class households: 22.48%
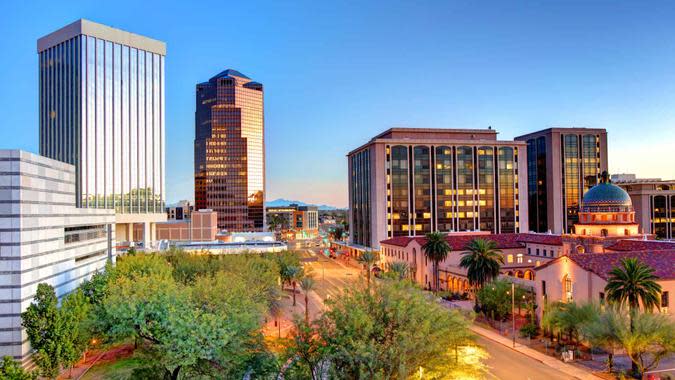
30. Tucson, Arizona
2022 total households: 220,769
2017 percent of households made up of the middle class: 35.4%
2022 percent of households made up of the middle class: 43.4%
5-year change in middle-class households: 22.60%
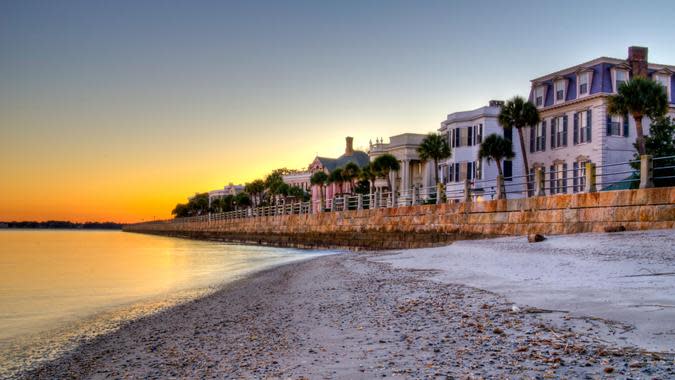
29. North Charleston, South Carolina
2022 total households: 45,917
2017 percent of households made up of the middle class: 37.4%
2022 percent of households made up of the middle class: 45.9%
5-year change in middle-class households: 22.73%
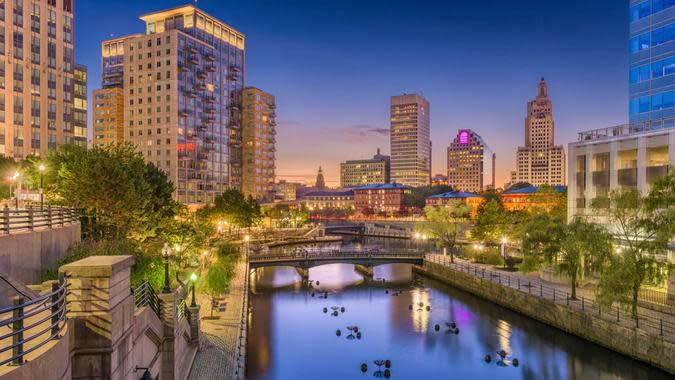
28. Providence, Rhode Island
2022 total households: 69,110
2017 percent of households made up of the middle class: 34.6%
2022 percent of households made up of the middle class: 42.5%
5-year change in middle-class households: 22.83%
Read More: I’m Part of the Upper Middle Class: Here’s What My Finances Look Like
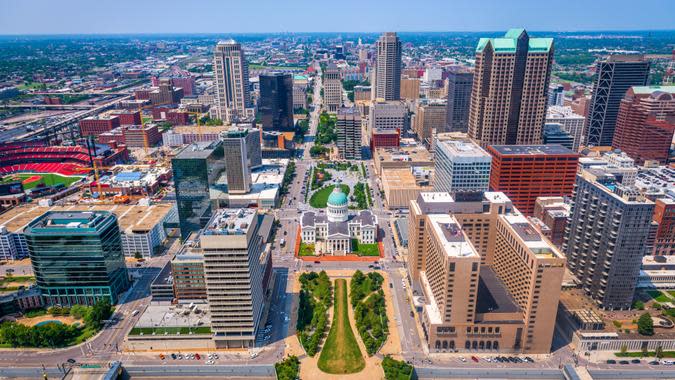
27. St. Louis, Missouri
2022 total households: 143,059
2017 percent of households made up of the middle class: 33.4%
2022 percent of households made up of the middle class: 41.1%
5-year change in middle-class households: 23.05%
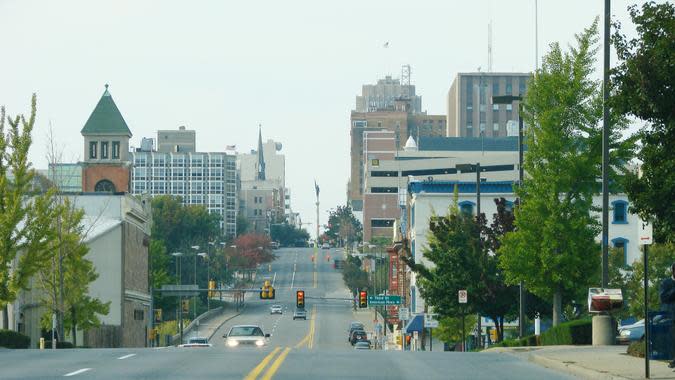
26. Allentown, Pennsylvania
2022 total households: 45,553
2017 percent of households made up of the middle class: 36.6%
2022 percent of households made up of the middle class: 45.2%
5-year change in middle-class households: 23.50%
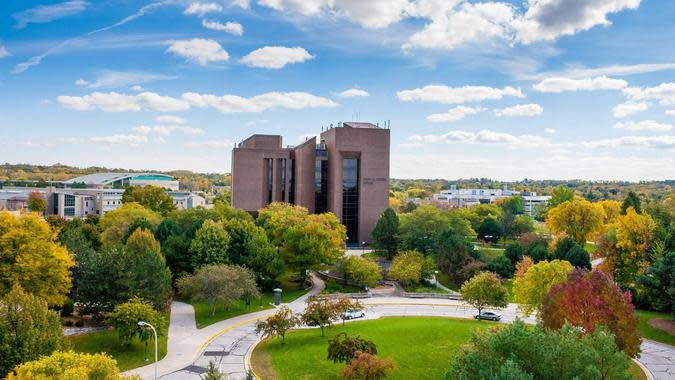
25. Green Bay, Wisconsin
2022 total households: 43,892
2017 percent of households made up of the middle class: 40.6%
2022 percent of households made up of the middle class: 50.4%
5-year change in middle-class households: 24.14%
24. Newark, New Jersey
2022 total households: 112,635
2017 percent of households made up of the middle class: 31.7%
2022 percent of households made up of the middle class: 39.4%
5-year change in middle-class households: 24.29%
23. Akron, Ohio
2022 total households: 83,935
2017 percent of households made up of the middle class: 33.3%
2022 percent of households made up of the middle class: 41.4%
5-year change in middle-class households: 24.32%
Discover More: 5 Unnecessary Bills You Should Stop Paying in 2024
22. Buffalo, New York
2022 total households: 118,897
2017 percent of households made up of the middle class: 31.2%
2022 percent of households made up of the middle class: 38.8%
5-year change in middle-class households: 24.36%
21. Kansas City, Kansas
2022 total households: 56,842
2017 percent of households made up of the middle class: 37.3%
2022 percent of households made up of the middle class: 46.5%
5-year change in middle-class households: 24.66%
20. Paterson, New Jersey
2022 total households: 49,678
2017 percent of households made up of the middle class: 32.8%
2022 percent of households made up of the middle class: 41.0%
5-year change in middle-class households: 25.00%
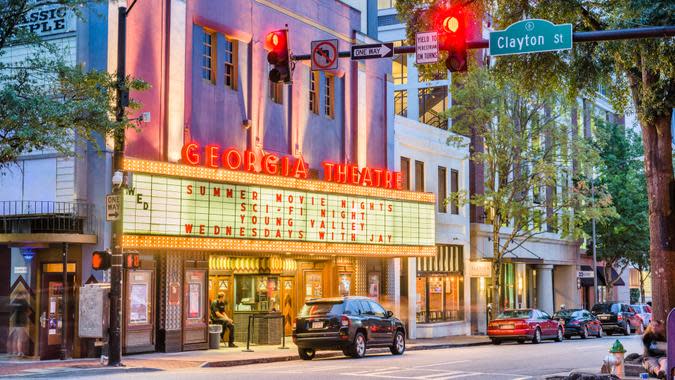
19. Athens, Georgia
2022 total households: 52,601
2017 percent of households made up of the middle class: 30.3%
2022 percent of households made up of the middle class: 37.9%
5-year change in middle-class households: 25.08%
Read More: 6 Things Minimalists Never Buy — and You Shouldn’t Either
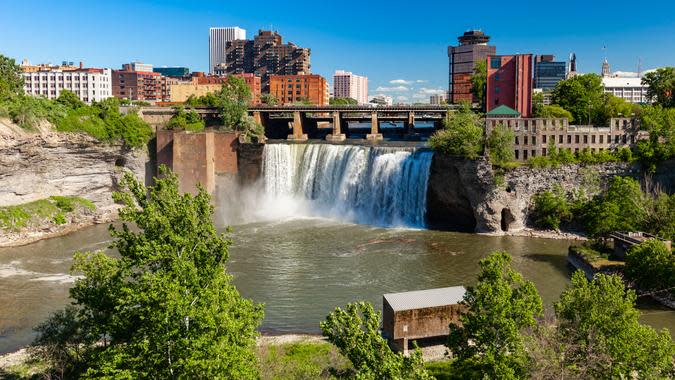
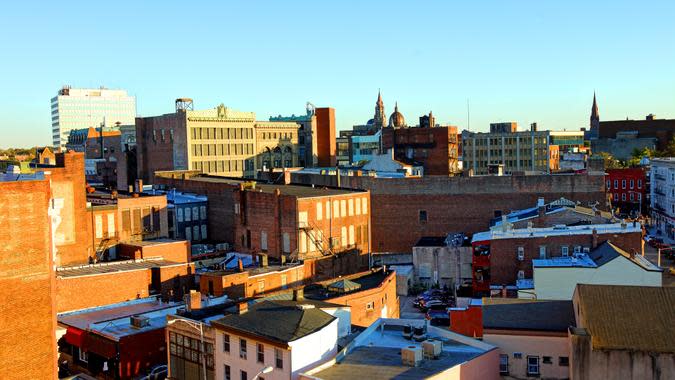
18. Rochester, New York
2022 total households: 91,315
2017 percent of households made up of the middle class: 29.5%
2022 percent of households made up of the middle class: 36.9%
5-year change in middle-class households: 25.08%
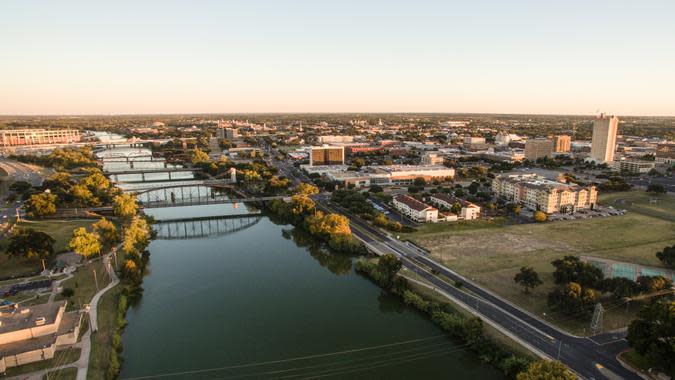
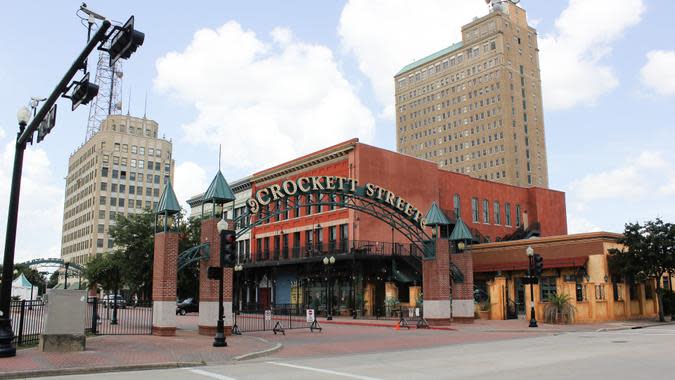
17. Waco, Texas
2022 total households: 52,256
2017 percent of households made up of the middle class: 30.7%
2022 percent of households made up of the middle class: 38.5%
5-year change in middle-class households: 25.41%

16. Spring Hill, Florida
2022 total households: 44,625
2017 percent of households made up of the middle class: 41.8%
2022 percent of households made up of the middle class: 52.6%
5-year change in middle-class households: 25.84%
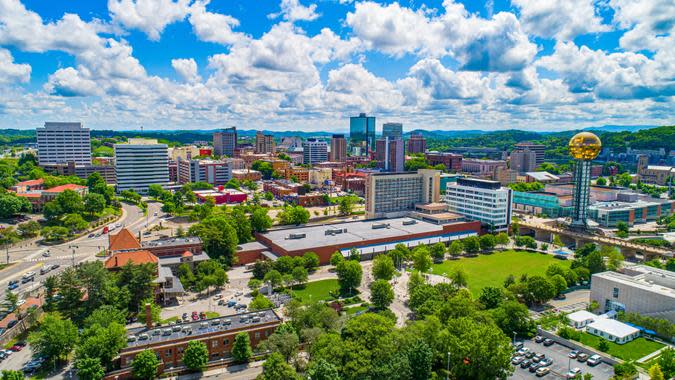
15. Knoxville, Tennessee
2022 total households: 84,195
2017 percent of households made up of the middle class: 31.8%
2022 percent of households made up of the middle class: 40.3%
5-year change in middle-class households: 26.73%
Find Out: 10 Expenses Most Likely To Drain Your Checking Account Each Month
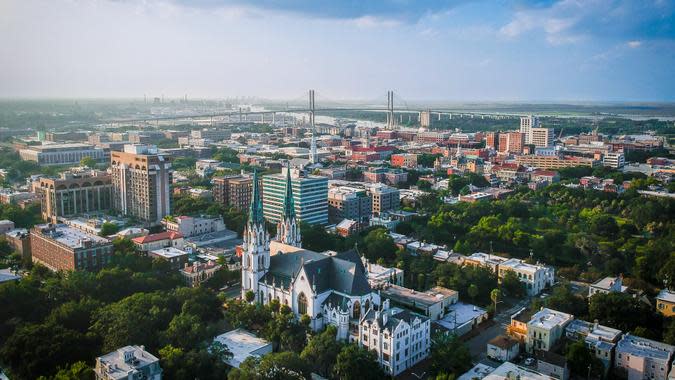
14. Savannah, Georgia
2022 total households: 57,673
2017 percent of households made up of the middle class: 34.3%
2022 percent of households made up of the middle class: 43.7%
5-year change in middle-class households: 27.41%
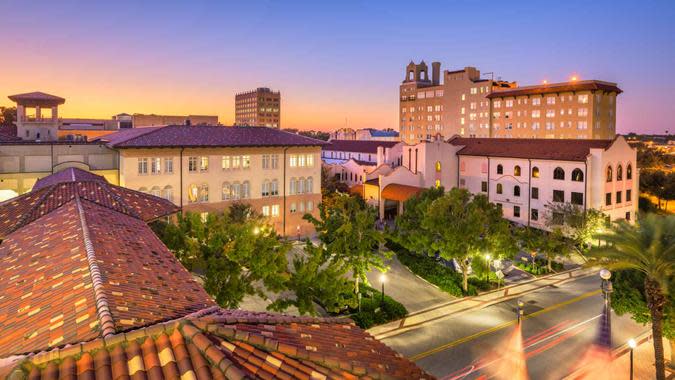
13. Lakeland, Florida
2022 total households: 44,323
2017 percent of households made up of the middle class: 37.0%
2022 percent of households made up of the middle class: 47.2%
5-year change in middle-class households: 27.57%
For You: Rachel Cruze: 3 Products That Aren’t Worth the Money
12. Pompano Beach, Florida
2022 total households: 46,038
2017 percent of households made up of the middle class: 38.0%
2022 percent of households made up of the middle class: 48.6%
5-year change in middle-class households: 27.89%
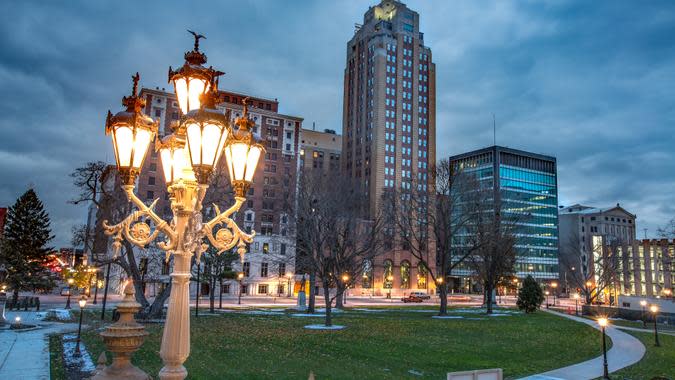
11. Lansing, Michigan
2022 total households: 50,137
2017 percent of households made up of the middle class: 35.4%
2022 percent of households made up of the middle class: 45.3%
5-year change in middle-class households: 27.97%
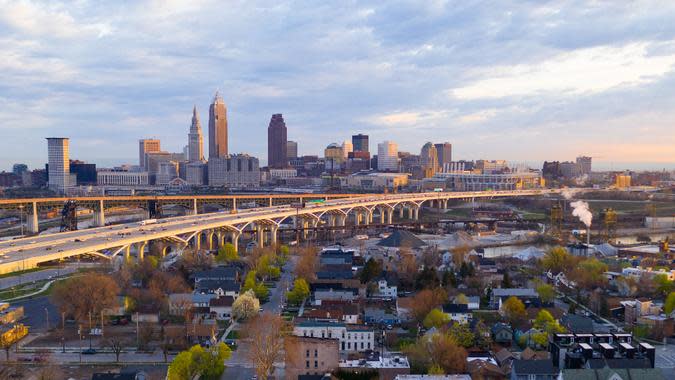
10. Cleveland, Ohio
2022 total households: 167,829
2017 percent of households made up of the middle class: 25.5%
2022 percent of households made up of the middle class: 32.8%
5-year change in middle-class households: 28.63%
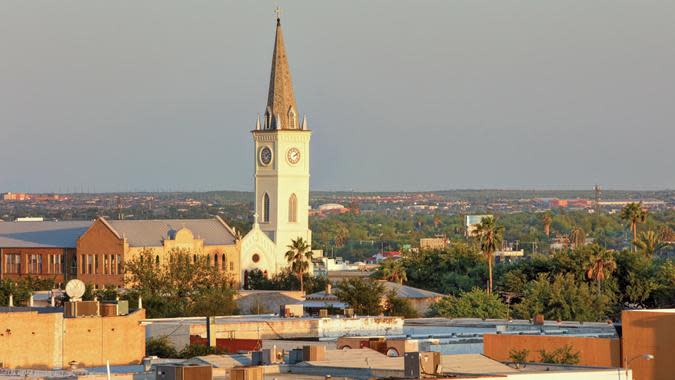
9. Laredo, Texas
2022 total households: 74,380
2017 percent of households made up of the middle class: 36.3%
2022 percent of households made up of the middle class: 47.1%
5-year change in middle-class households: 29.75%
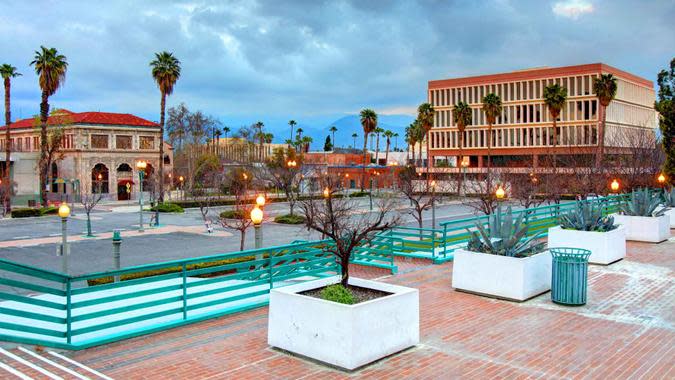
8. San Bernardino, California
2022 total households: 62,486
2017 percent of households made up of the middle class: 36.7%
2022 percent of households made up of the middle class: 47.8%
5-year change in middle-class households: 30.25%
Check Out: How Much Money You’d Owe If the National Debt Was Divided by Household

7. Palm Bay, Florida
2022 total households: 42,865
2017 percent of households made up of the middle class: 41.4%
2022 percent of households made up of the middle class: 54.0%
5-year change in middle-class households: 30.43%
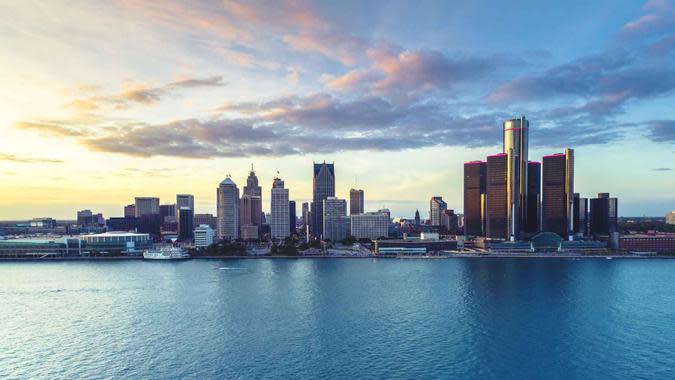
6. Detroit, Michigan
2022 total households: 249,518
2017 percent of households made up of the middle class: 24.9%
2022 percent of households made up of the middle class: 32.8%
5-year change in middle-class households: 31.73%
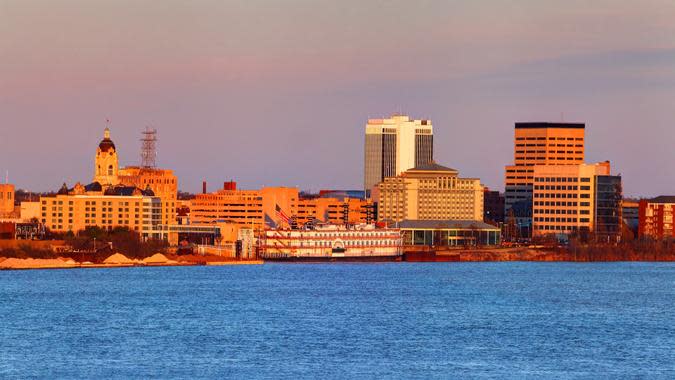
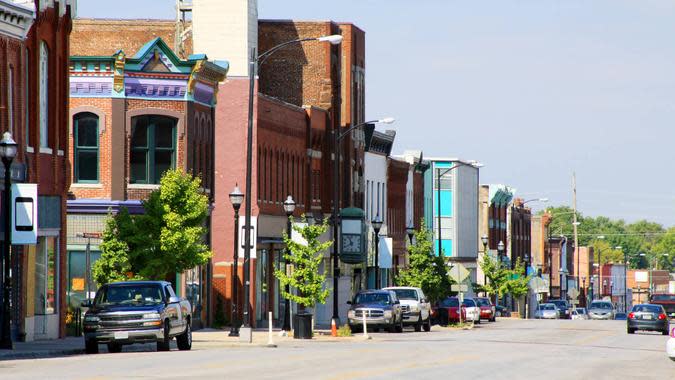
5. Evansville, Indiana
2022 total households: 52,070
2017 percent of households made up of the middle class: 33.4%
2022 percent of households made up of the middle class: 44.4%
5-year change in middle-class households: 32.93%
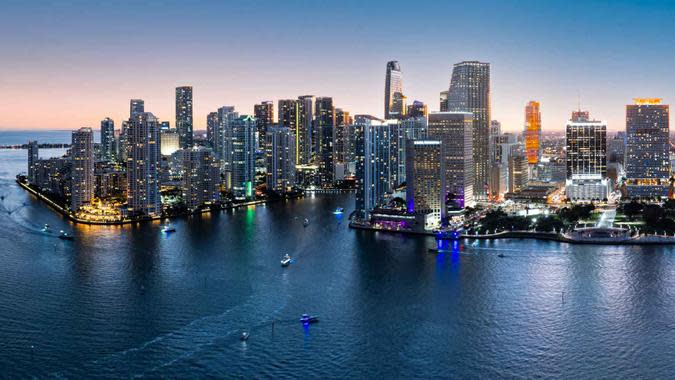
4. Miami, Florida
2022 total households: 186,137
2017 percent of households made up of the middle class: 28.6%
2022 percent of households made up of the middle class: 38.3%
5-year change in middle-class households: 33.92%
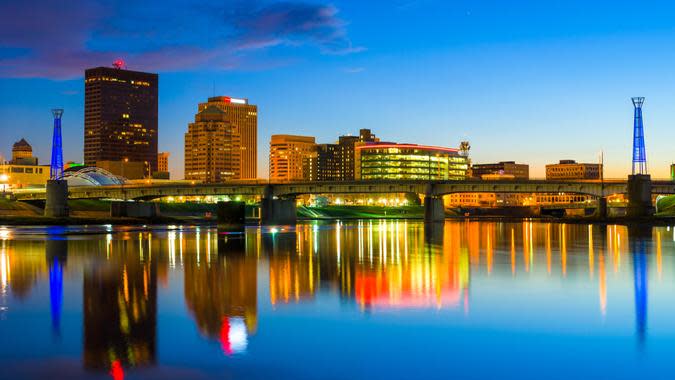
3. Dayton, Ohio
2022 total households: 57,362
2017 percent of households made up of the middle class: 27.3%
2022 percent of households made up of the middle class: 36.7%
5-year change in middle-class households: 34.43%
Read Next: 5 Types of Homes That Will Plummet in Value in 2024
2. Pueblo, Colorado
2022 total households: 45,782
2017 percent of households made up of the middle class: 32.0%
2022 percent of households made up of the middle class: 44.4%
5-year change in middle-class households: 38.75%
1. Hialeah, Florida
2022 total households: 76,255
2017 percent of households made up of the middle class: 28.3%
2022 percent of households made up of the middle class: 41.5%
5-year change in middle-class households: 46.64%
Methodology: GOBankingRates looked at all United States cities with above 40,000 households, as sourced from the 2022 American Community Survey, in order to find the 50 cities where the middle class has grown the most. GOBankingRates found what percent of each city’s households in 2022 would be considered upper class (earning between $50,000 and $149,999). The cities were ranked on a five-year change in percentage of upper-class households (2017 – 2022). The 50 cities with the greatest change were included in the final rankings. This was the only ranking factor, and all data was collected from the 2017 and 2022 American Community Surveys conducted by the United States Census Bureau. Supplemental data for each city was found on the 5-year change in households making $50,000-$74,999, $75,000-$99,999, and $100,000 – $149,999). All data was compiled on and up to date as of February 13, 2024.
More From GOBankingRates
What Makes a Good Bank in 2024, According to a Banking Expert
I'm a Personal Finance Writer: These Are the Worst Money Mistakes I Made in 2023
This article originally appeared on GOBankingRates.com: America’s Middle Class Is Growing the Most in These 50 Cities
