
 Yahoo Finance
 Amazon.com's (NASDAQ:AMZN) five-year earnings growth trails the 33% YoY shareholder returns
Long term investing can be life changing when you buy and hold the truly great businesses. While not every stock performs well, when investors win, they can win big. For example, the Amazon.com, Inc. (NASDAQ:AMZN) share price is up a whopping 316% in the last half decade, a handsome return for long term holders. This just goes to show the value creation that some businesses can achieve. Better yet, the share price has risen 3.7% in the last week. But this might be partly because the broader market had a good week last week, gaining 2.0%.
After a strong gain in the past week, it's worth seeing if longer term returns have been driven by improving fundamentals.
See our latest analysis for Amazon.com
To quote Buffett, 'Ships will sail around the world but the Flat Earth Society will flourish. There will continue to be wide discrepancies between price and value in the marketplace...' By comparing earnings per share (EPS) and share price changes over time, we can get a feel for how investor attitudes to a company have morphed over time.
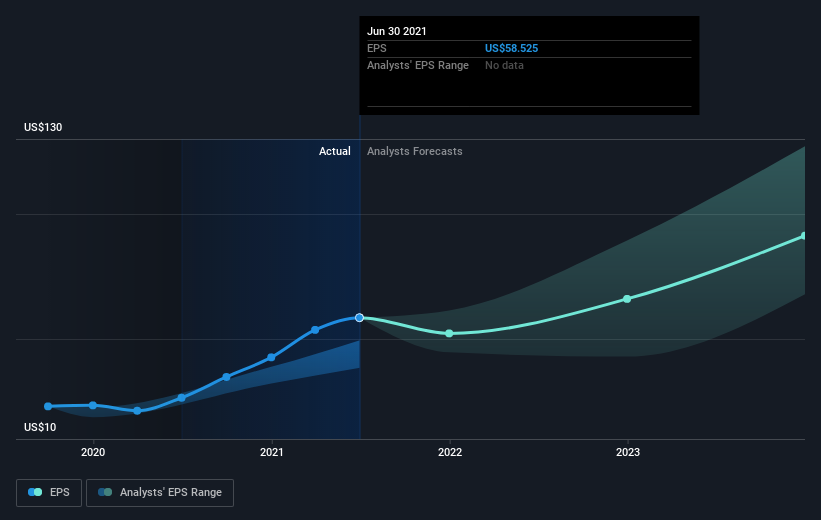
During five years of share price growth, Amazon.com achieved compound earnings per share (EPS) growth of 70% per year. This EPS growth is higher than the 33% average annual increase in the share price. So it seems the market isn't so enthusiastic about the stock these days. Of course, with a P/E ratio of 58.65, the market remains optimistic.
The graphic below depicts how EPS has changed over time (unveil the exact values by clicking on the image).
We know that Amazon.com has improved its bottom line over the last three years, but what does the future have in store? You can see how its balance sheet has strengthened (or weakened) over time in this free interactive graphic.
A Different Perspective
Amazon.com shareholders are up 4.2% for the year. But that was short of the market average. It's probably a good sign that the company has an even better long term track record, having provided shareholders with an annual TSR of 33% over five years. It may well be that this is a business worth popping on the watching, given the continuing positive reception, over time, from the market. While it is well worth considering the different impacts that market conditions can have on the share price, there are other factors that are even more important. For example, we've discovered 2 warning signs for Amazon.com (1 is significant!) that you should be aware of before investing here.
But note: Amazon.com may not be the best stock to buy. So take a peek at this free list of interesting companies with past earnings growth (and further growth forecast).
Please note, the market returns quoted in this article reflect the market weighted average returns of stocks that currently trade on US exchanges.
This article by Simply Wall St is general in nature. We provide commentary based on historical data and analyst forecasts only using an unbiased methodology and our articles are not intended to be financial advice. It does not constitute a recommendation to buy or sell any stock, and does not take account of your objectives, or your financial situation. We aim to bring you long-term focused analysis driven by fundamental data. Note that our analysis may not factor in the latest price-sensitive company announcements or qualitative material. Simply Wall St has no position in any stocks mentioned.
Have feedback on this article? Concerned about the content? Get in touch with us directly. Alternatively, email editorial-team (at) simplywallst.com.

