
 Yahoo Finance
 Alliance Global Group Inc's Dividend Analysis
Insight into Alliance Global Group Inc's Upcoming Dividend
Alliance Global Group Inc (ALGGF) recently announced a dividend of $0.15 per share, payable on 2024-01-12, with the ex-dividend date set for 2023-12-15. As investors look forward to this upcoming payment, the spotlight also shines on the company's dividend history, yield, and growth rates. Using the data from GuruFocus, let's look into Alliance Global Group Inc's dividend performance and assess its sustainability.
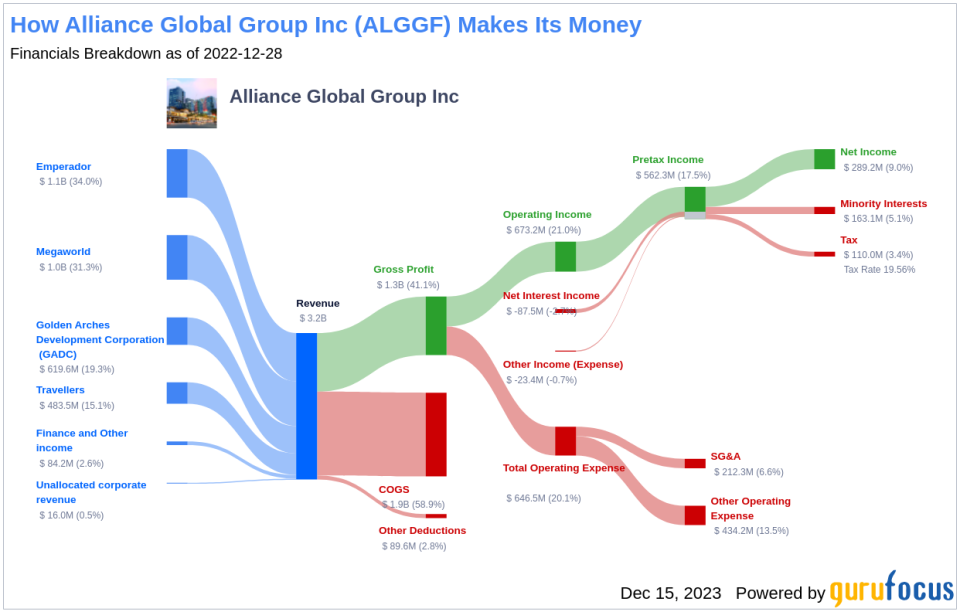
What Does Alliance Global Group Inc Do?
This Powerful Chart Made Peter Lynch 29% A Year For 13 Years
How to calculate the intrinsic value of a stock?
Alliance Global Group Inc is a Philippine business conglomerate that operates four business segments: Megaworld, Travellers, GADC, and Emperador. Megaworld includes the development of real estate, integrated resorts, leasing of properties, and hotel operations. Emperador consists of the manufacturing and distribution of distilled spirits and glass containers. The other segments offer tourism-related entertainment, hospitality, and leisure activities, as well as the operation of McDonald's restaurants in the Philippines.
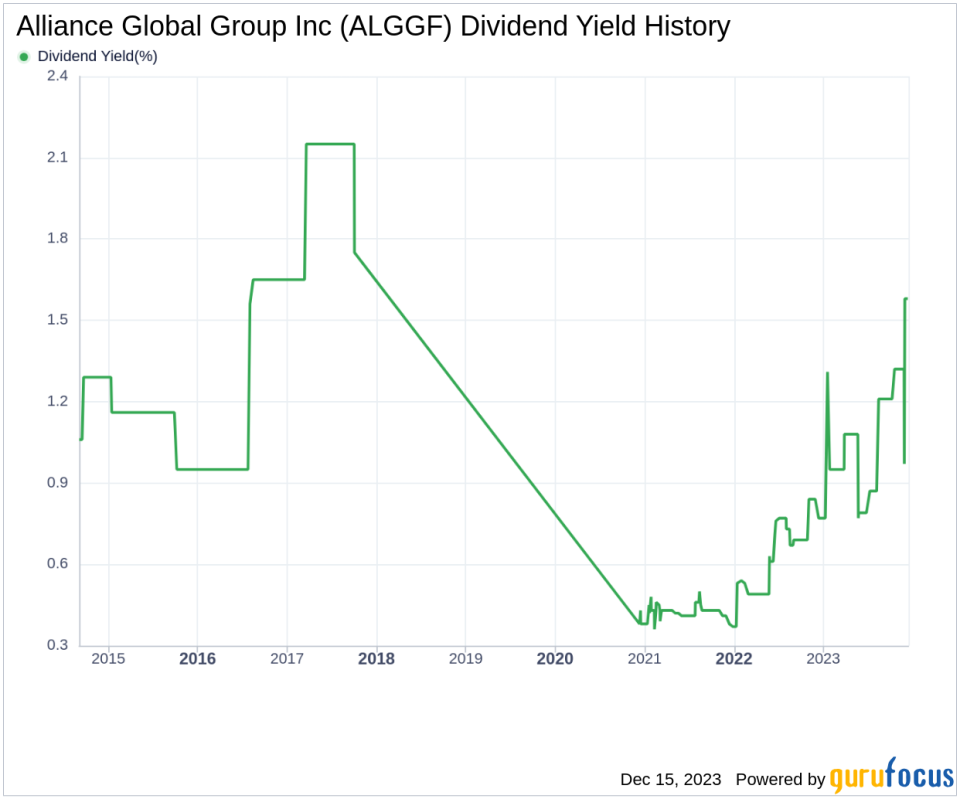
A Glimpse at Alliance Global Group Inc's Dividend History
Alliance Global Group Inc has maintained a consistent dividend payment record since 2020. Dividends are currently distributed on a yearly basis. Below is a chart showing annual Dividends Per Share for tracking historical trends.
Breaking Down Alliance Global Group Inc's Dividend Yield and Growth
As of today, Alliance Global Group Inc currently has a 12-month trailing dividend yield of 1.58% and a 12-month forward dividend yield of 1.96%. This suggests an expectation of increased dividend payments over the next 12 months. Based on Alliance Global Group Inc's dividend yield and five-year growth rate, the 5-year yield on cost of Alliance Global Group Inc stock as of today is approximately 1.58%.
The Sustainability Question: Payout Ratio and Profitability
To assess the sustainability of the dividend, one needs to evaluate the company's payout ratio. The dividend payout ratio provides insights into the portion of earnings the company distributes as dividends. A lower ratio suggests that the company retains a significant part of its earnings, thereby ensuring the availability of funds for future growth and unexpected downturns. As of 2023-09-30, Alliance Global Group Inc's dividend payout ratio is 0.06.
Alliance Global Group Inc's profitability rank, offers an understanding of the company's earnings prowess relative to its peers. GuruFocus ranks Alliance Global Group Inc's profitability 8 out of 10 as of 2023-09-30, suggesting good profitability prospects. The company has reported positive net income for each of year over the past decade, further solidifying its high profitability.
Growth Metrics: The Future Outlook
To ensure the sustainability of dividends, a company must have robust growth metrics. Alliance Global Group Inc's growth rank of 8 out of 10 suggests that the company's growth trajectory is good relative to its competitors. Alliance Global Group Inc's revenue has increased by approximately 3.50% per year on average, a rate that underperforms approximately 55.84% of global competitors.
The company's 3-year EPS growth rate showcases its capability to grow its earnings, a critical component for sustaining dividends in the long run. During the past three years, Alliance Global Group Inc's earnings increased by approximately -0.50% per year on average, a rate that underperforms approximately 71.27% of global competitors.
Lastly, the company's 5-year EBITDA growth rate of 3.50%, which underperforms approximately 65.59% of global competitors.
Concluding Thoughts on Alliance Global Group Inc's Dividend Outlook
In conclusion, Alliance Global Group Inc's upcoming dividend payment, along with its history and growth rates, presents a mixed picture for value investors. While the company's dividend yield is modest and its payout ratio is low, indicating room for future dividend growth, its growth metrics suggest some challenges ahead. Investors should consider Alliance Global Group Inc's competitive position, profitability, and strategic initiatives when evaluating the sustainability of its dividend payments. With a profitability rank that speaks to the company's earnings strength, could Alliance Global Group Inc be poised to continue rewarding shareholders amidst a challenging growth environment?
GuruFocus Premium users can screen for high-dividend yield stocks using the High Dividend Yield Screener.
This article, generated by GuruFocus, is designed to provide general insights and is not tailored financial advice. Our commentary is rooted in historical data and analyst projections, utilizing an impartial methodology, and is not intended to serve as specific investment guidance. It does not formulate a recommendation to purchase or divest any stock and does not consider individual investment objectives or financial circumstances. Our objective is to deliver long-term, fundamental data-driven analysis. Be aware that our analysis might not incorporate the most recent, price-sensitive company announcements or qualitative information. GuruFocus holds no position in the stocks mentioned herein.
This article first appeared on GuruFocus.
