
 Yahoo Finance
 Allegiant (ALGT) Stock Up 4.3% on Q4 Earnings & Revenue Beat
Allegiant Travel Company (ALGT) shares gained 4.3% since its fourth-quarter 2023 earnings release on Feb 5. Quarterly earnings per share (EPS) came in at 11 cents against the Zacks Consensus Estimate’s loss of 67 cents. Operating revenues of $611 million outperformed the Zacks Consensus Estimate of $601.5 million but decreased marginally on a year-over-year basis.
Passenger revenues, which accounted for the bulk (91%) of the top line, fell 1.5% on a year-over-year basis. Air traffic (measured in revenue passenger miles) for scheduled service grew 3.2% year over year in the quarter under review. Capacity (measured in available seat miles or ASMs) rose 5.7% from the year-ago number. The load factor (percentage of seats filled by passengers) decreased to 83.3% from 85.3% in the reported quarter, as traffic did not outperform capacity.
Operating cost per available seat miles, excluding fuel, jumped 10.8% year over year to 8.50 cents. Average fuel cost per gallon (scheduled) decreased 10.6% to $3.20. Total scheduled service passenger revenue per available seat miles fell to 13.16 cents from 14.03 cents a year ago.
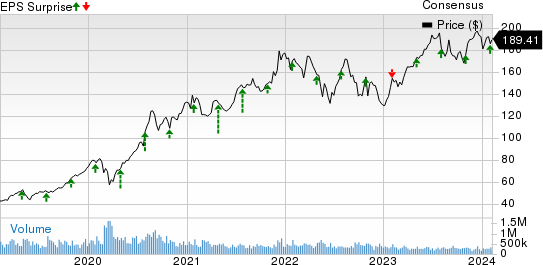
Allegiant Travel Company Price, Consensus and EPS Surprise
Allegiant Travel Company price-consensus-eps-surprise-chart | Allegiant Travel Company Quote
Liquidity
As of Dec 31, 2023, Allegiant’s total unrestricted cash and investments were $870.7 million compared with $1,007 million at the third-quarter end. Long-term debt and finance lease obligations (net of current maturities and related costs) totaled $1,819.7 million compared with $2,020 million at the prior-quarter end.
Guidance
For the first quarter of 2024, ASM (for scheduled service) is expected to increase 1% on a year-over-year basis. Total system ASM is projected to rise 1% on a year-over-year basis.
Operating margin is expected to be between 8% and 10%. EPS (airline) is anticipated to be in the range of $1.00-$2.00. Fuel cost per gallon is expected to be $2.85.
For 2024, ASM (for scheduled service) is expected to increase in the range of 2-6% on a year-over-year basis. Total system ASM is projected to rise 2-6% on a year-over-year basis.
Interest expenses are anticipated to be in the range of $140-$150 million.
Under airline capex, aircraft, engines, induction costs and pre-delivery deposits are expected to be in the $535-$555 million band. Capitalized deferred heavy maintenance is envisioned to be between $80 million and $90 million. Other airline capital expenditures are expected to be between $155 million and $165 million.
The company aims to expand its fleet size to 130 by 2024-end.
Allegiant carries a Zacks Rank #3 (Hold). You can see the complete list of today’s Zacks #1 Rank (Strong Buy) stocks here
Performances of Other Transportation Companies
J.B. Hunt Transport Services, Inc.’s JBHT fourth-quarter 2023 EPS of $1.47 missed the Zacks Consensus Estimate of $1.74 and declined 23.4% year over year.
JBHT’s total operating revenues of $3,303.70million surpassed the Zacks Consensus Estimate of $3,236.2 million but fell 9.5% year over year. Total operating revenues, excluding fuel surcharge revenue, fell 6% year over year.
Delta Air Lines DAL has reported fourth-quarter 2023 EPS (excluding $1.88 from non-recurring items) of $1.28, which comfortably beat the Zacks Consensus Estimate of $1.17. Earnings, however, declined 13.51% on a year-over-year basis due to high labor costs.
Revenues of $14,223 million surpassed the Zacks Consensus Estimate of $14,069.5 million and increased 5.87% on a year-over-year basis, driven by strong holiday-air-travel demand. Adjusted operating revenues (excluding third-party refinery sales) came in at $13,661 million, up 11% year over year.
United Airlines Holdings, Inc. (UAL)reported fourth-quarter 2023 EPS (excluding 19 cents from non-recurring items) of $2.00, which outpaced the Zacks Consensus Estimate of $1.61 but declined 18.7% year over year.
Operating revenues of $13,626 million beat the Zacks Consensus Estimate of $13,546.8 million. The top line increased 9.9% year over year due to upbeat air-travel demand. This was driven by a 10.9% rise in passenger revenues (accounting for 91.1% of the top line) to $12,421 million. Almost 41,779 passengers traveled on UAL flights in the fourth quarter.
Want the latest recommendations from Zacks Investment Research? Today, you can download 7 Best Stocks for the Next 30 Days. Click to get this free report
Delta Air Lines, Inc. (DAL) : Free Stock Analysis Report
United Airlines Holdings Inc (UAL) : Free Stock Analysis Report
J.B. Hunt Transport Services, Inc. (JBHT) : Free Stock Analysis Report
Allegiant Travel Company (ALGT) : Free Stock Analysis Report
