
 Yahoo Finance
 Airbnb (ABNB) Q2 Earnings Beat Estimates, Revenues Up Y/Y
Airbnb ABNB reported second-quarter 2023 earnings of 98 cents per share, which beat the Zacks Consensus Estimate by 27.27% and jumped 75% year over year.
Revenues of $2.48 billion increased 18.1% on a reported basis and 19% on a forex-neutral basis, respectively, year over year. The top line also surpassed the consensus mark by 2.81%.
The year-over-year increase was driven by a continuous improvement in Nights and Experiences Booked. Also, growing Gross Booking Value (GBV) remained a tailwind.
Growing gross nights booked, owing to solid momentum across high-density urban areas, remained a positive. Increasing guest demand and a continuous recovery in cross-border travel aided the quarterly performance.
Airbnb, Inc. Price, Consensus and EPS Surprise
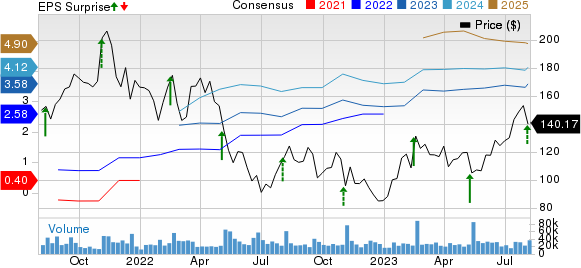
Airbnb, Inc. price-consensus-eps-surprise-chart | Airbnb, Inc. Quote
ABNB shares were relatively unchanged, closing at $140.17 on Aug 4 following the results. Shares have returned 63.9% year to date, outperforming the Zacks Computer & Technology sector’s return of 37.3%.
Quarterly Details
Nights and Experiences Booked were 115.1 million, up 11% on a year-over-year basis. The metric was driven by strong performances in all regions, particularly Asia Pacific.
GBV amounted to $19.1 billion, which rose 13% from the prior-year quarter’s reported figure. GBV per Night and Experience Booked (or Average Daily Rates) was $166.01, which increased 1% on a year-over-year basis.
In the reported quarter, active listings increased 19% year over year. Airbnb’s total active listings are now more than 7 million. The company witnessed double-digit supply growth across all regions, with the most growth in Asia Pacific and Latin America.
In terms of trip length, the category of long-term stays of 28 days or more, which accounted for 18% of overall gross nights booked, remained a positive. In the reported quarter, gross nights booked in high-density urban areas increased 13% year over year and accounted for 48% of gross nights.
Cross-border travel for the second quarter increased 16% year over year, particularly, cross-border travel to Asia Pacific grew more than 80%. Cross-border travel to North America increased 20%. Guests traveling more than 3,000 miles increased 20% year over year. Cross-border represented 45% of total gross nights booked, up from 43% in the year-ago quarter.
Operating Results
Adjusted EBITDA was $819 million, up 15.2% year over year.
Operations and support costs surged 23.7% year over year to $298 million. Product development expenses increased 13% year over year to $260 million.
Sales and marketing expenses rose 25% from the year-ago quarter’s figure to $465 million. General and administrative expenses were $217 million, up 15.4% year over year.
For the second quarter, Airbnb reported an operating income of $523 million, up 41.7% year over year.
Balance Sheet & Cash Flow
As of Jun 30, 2023, cash and cash equivalents and short-term investments amounted to $9.62 billion compared with $10.6 billion as of Mar 31, 2023.
Long-term debt, as of Jun 30, 2023, was $1.987 billion compared with $1.988 billion as of Mar 31, 2023.
Net cash provided by operating activities was $909 million for the second quarter of 2023, significantly down from $1.587 billion in the previous quarter.
Airbnb generated a free cash flow of $900 million compared with $1.581 billion in the previous quarter.
Guidance
For third-quarter 2023, Airbnb expects revenues between $3.3 billion and $3.4 billion, implying year-over-year growth in the band of 14-18% on a reported basis. The Zacks Consensus Estimate is pegged at $2.43 billion.
Airbnb believes revenue growth will outpace Nights and Experiences Booked growth in the third quarter.
Adjusted EBITDA margin is expected to increase on year-over-year growth.
Zacks Rank & Other Stocks to Consider
Currently, Airbnb carries a Zacks Rank #2 (Buy).
BILL Holdings BILL, CACI International CACI and Cisco Systems CSCO are some other top-ranked stocks that investors can consider in the broader sector, each carrying a Zacks Rank #2 at present. You can see the complete list of today’s Zacks #1 Rank (Strong Buy) stocks here.
BILL Holdings shares have gained 4.5% year to date. BILL is set to report its fourth-quarter fiscal 2023 results on Aug 17.
CACI International shares have gained 18.1% year to date. CACI is set to report its fourth-quarter fiscal 2023 results on Aug 9.
Cisco Systems shares have returned 11.1% year to date. CSCO is set to report its fourth-quarter fiscal 2023 results on Aug 16.
Want the latest recommendations from Zacks Investment Research? Today, you can download 7 Best Stocks for the Next 30 Days. Click to get this free report
Cisco Systems, Inc. (CSCO) : Free Stock Analysis Report
CACI International, Inc. (CACI) : Free Stock Analysis Report
BILL Holdings, Inc. (BILL) : Free Stock Analysis Report
Airbnb, Inc. (ABNB) : Free Stock Analysis Report
