
 Yahoo Finance
 Agilent (A) Misses Earnings and Revenue Estimates in Q2
Agilent Technologies’ A fiscal second-quarter 2019 earnings of 71 cents per share missed the Zacks Consensus Estimate by a penny. The bottom line decreased 6.6% sequentially but increased 9.2% year over year.
Fiscal second-quarter 2019 revenues of $1.24 billion increased 2.7% year over year. The reported revenues, which came in below management’s guided range of $1.255-$1.270 billion, missed the Zacks Consensus Estimate of $1.27 billion.
The year-over-year revenue growth was supported by notable improvement across its ACG and DGG segments.
Following the company’s weaker-than-expected fiscal second-quarter earnings, the share price was down 9.92% in after-hours trading.
However, the stock has gained 11.8% in the past year compared with its industry’s growth of 9.9%.

Revenues by Segment
Agilent has three reporting segments — Life Sciences & Applied Markets Group (LSAG), Agilent Cross Lab Group (ACG), and Diagnostics and Genomics Group (DGG).
In the reported quarter, LSAG was the largest contributor to total revenues. The segment accounted for $529 million or 43% of its total revenues, reflecting a decrease of 1% from the prior-year quarter. The demand in environmental and forensics markets was strong, offset by weakness in pharma and food markets. Slowing of internal orders in China affected this segment.
Revenues from ACG came in at $455 million, accounting for 37% of the total revenues, reflecting a 7% year-over-year increase. Both services and consumables recorded growth across all geographical regions, led by China.
Revenues from DGG came in at $254 million, accounting for the remaining 20% of the total revenues. The segment’s revenues were up 5% from the year-ago quarter, led by strength in the company’s pathology-related businesses and Nucleic Acid Solutions Division (NASD).
Operating Results
Gross margin in the quarter was 56%, up 70 basis points (bps) year over year. The increase was due to a favorable product mix.
Operating expenses (research & development as well as selling, general & administrative) were $453 million, 4.6% higher than the year-ago quarter.
As a result, adjusted operating margin was 17.4%, flat with the year-ago quarter.
Balance Sheet
At the end of the fiscal second quarter, inventories totaled $657 million, reflecting an increase from $653 million in the comparable prior-year period. Agilent’s long-term debt was $1.8 billion at the end of the quarter. Cash and cash equivalents were $2.2 billion compared with $2.1 billion in fiscal first-quarter 2019.
Guidance
Agilent provided guidance for the fiscal third quarter and revised the same for fiscal 2019.
For the fiscal third quarter, the company expects revenues between $1.225 billion and $1.245 billion, and earnings per share in the range of 71-73 cents. The Zacks Consensus Estimate for revenues and earnings per share is pegged at $1.27 billion and 73 cents, respectively.
For fiscal 2019, Agilent has lowered revenue projection in the range of $5.085-$5.125 billion versus previous expectation of $5.15-$5.19 billion. However, the company maintained its non-GAAP earnings guided range of $3.03-$3.07 per share.
The Zacks Consensus Estimate for earnings is pegged at $3.06 per share and the same for revenues is $5.18 billion.
Agilent Technologies, Inc. Price, Consensus and EPS Surprise
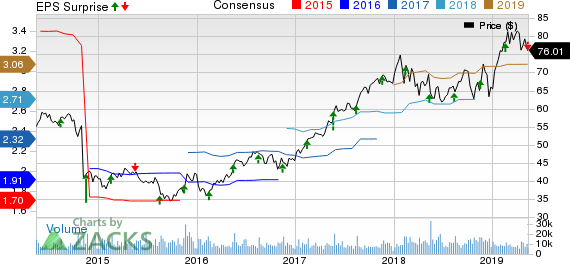
Agilent Technologies, Inc. price-consensus-eps-surprise-chart | Agilent Technologies, Inc. Quote
Zacks Rank and Other Stocks to Consider
Currently, Agilent has a Zacks Rank #2 (Buy). Other top-ranked stocks in the broader technology sector include Facebook, Inc. FB, Shopify Inc. SHOP and AXT, Inc. AXTI, each carrying a Zacks Rank #2. You can see the complete list of today’s Zacks #1 Rank (Strong Buy) stocks here.
Long-term earnings growth for Facebook, Shopify and AXT is currently projected at 20.2%, 23.7% and 15%, respectively.
Will you retire a millionaire?
One out of every six people retires a multimillionaire. Get smart tips you can do today to become one of them in a new Special Report, “7 Things You Can Do Now to Retire a Multimillionaire.”
Click to get it free >>
Want the latest recommendations from Zacks Investment Research? Today, you can download 7 Best Stocks for the Next 30 Days. Click to get this free report
Shopify Inc. (SHOP) : Free Stock Analysis Report
Facebook, Inc. (FB) : Free Stock Analysis Report
AXT Inc (AXTI) : Free Stock Analysis Report
Agilent Technologies, Inc. (A) : Free Stock Analysis Report
To read this article on Zacks.com click here.
