
 Yahoo Finance
 AdvanSix (NYSE:ASIX) Could Be Struggling To Allocate Capital
Did you know there are some financial metrics that can provide clues of a potential multi-bagger? Firstly, we'll want to see a proven return on capital employed (ROCE) that is increasing, and secondly, an expanding base of capital employed. Put simply, these types of businesses are compounding machines, meaning they are continually reinvesting their earnings at ever-higher rates of return. Having said that, from a first glance at AdvanSix (NYSE:ASIX) we aren't jumping out of our chairs at how returns are trending, but let's have a deeper look.
What Is Return On Capital Employed (ROCE)?
Just to clarify if you're unsure, ROCE is a metric for evaluating how much pre-tax income (in percentage terms) a company earns on the capital invested in its business. To calculate this metric for AdvanSix, this is the formula:
Return on Capital Employed = Earnings Before Interest and Tax (EBIT) ÷ (Total Assets - Current Liabilities)
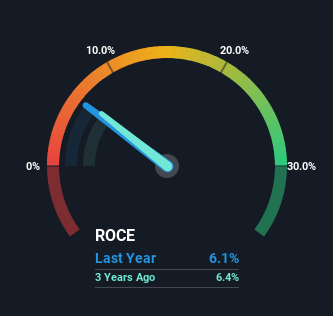
0.061 = US$70m ÷ (US$1.5b - US$359m) (Based on the trailing twelve months to December 2023).
So, AdvanSix has an ROCE of 6.1%. Ultimately, that's a low return and it under-performs the Chemicals industry average of 9.8%.
Check out our latest analysis for AdvanSix
In the above chart we have measured AdvanSix's prior ROCE against its prior performance, but the future is arguably more important. If you'd like, you can check out the forecasts from the analysts covering AdvanSix for free.
What The Trend Of ROCE Can Tell Us
In terms of AdvanSix's historical ROCE movements, the trend isn't fantastic. Around five years ago the returns on capital were 12%, but since then they've fallen to 6.1%. And considering revenue has dropped while employing more capital, we'd be cautious. This could mean that the business is losing its competitive advantage or market share, because while more money is being put into ventures, it's actually producing a lower return - "less bang for their buck" per se.
The Bottom Line On AdvanSix's ROCE
We're a bit apprehensive about AdvanSix because despite more capital being deployed in the business, returns on that capital and sales have both fallen. It should come as no surprise then that the stock has fallen 16% over the last five years, so it looks like investors are recognizing these changes. That being the case, unless the underlying trends revert to a more positive trajectory, we'd consider looking elsewhere.
One more thing, we've spotted 2 warning signs facing AdvanSix that you might find interesting.
If you want to search for solid companies with great earnings, check out this free list of companies with good balance sheets and impressive returns on equity.
Have feedback on this article? Concerned about the content? Get in touch with us directly. Alternatively, email editorial-team (at) simplywallst.com.
This article by Simply Wall St is general in nature. We provide commentary based on historical data and analyst forecasts only using an unbiased methodology and our articles are not intended to be financial advice. It does not constitute a recommendation to buy or sell any stock, and does not take account of your objectives, or your financial situation. We aim to bring you long-term focused analysis driven by fundamental data. Note that our analysis may not factor in the latest price-sensitive company announcements or qualitative material. Simply Wall St has no position in any stocks mentioned.
