
 Yahoo Finance
 ABM Industries (ABM) Q2 Earnings & Revenues Beat Estimates
ABM Industries Incorporated ABM reported impressive second-quarter fiscal 2024 results, wherein earnings per share (EPS) and revenues surpassed the Zacks Consensus Estimate.
ABM’s EPS (excluding 18 cents from non-recurring items) was 87 cents, which beat the Zacks Consensus Estimate by 11.5% but decreased 3.3% from the year-ago quarter. Total revenues of $2 billion outpaced the consensus mark by 1% and increased 1.7% on a year-over-year basis.
The company’s shares have gained 15.5% in the past three months, outperforming the 5.5% rally of the industry it belongs to.
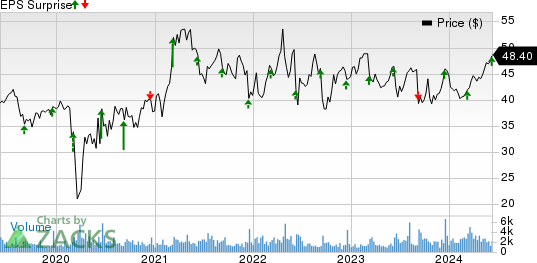
ABM Industries Incorporated Price and EPS Surprise
ABM Industries Incorporated price-eps-surprise | ABM Industries Incorporated Quote
Segmental Revenues
The Aviation segment’s revenues gained 4.8% from the year-ago quarter to $238.2 million and missed our extimate of $240.6 million. The metric was driven primarily by robust travel markets, and business wins on airport and airline for the business.
Technical Solutions increased 4.6% from second-quarter fiscal 2023 to $176.2 million. The metric missed our estimate of $179.3 million.The rise in Technical Solutions revenues was led by the strength of micro grid project startups, and growth in the mission-critical and power business.
The Education segment’s revenues amounted to $225.6 million, indicating a 4.1% rise from the year-ago quarter. It outpaced our estimate of $219.7 million. The addition of clients resulted in this segment’s revenues.
Revenues from the Manufacturing & Distribution segment increased 4.1% to $388.6 million, beating our estimate of $373.5 million. Solid demand in this segment drove its revenues.
The Business & Industry segment’s revenues decreased marginally on a year-over-year basis to $989.6 million and surpassed our estimate of $978.3 million. The marginal decline in revenues was due to the soft commercial real estate market.
Profitability Performance
Adjusted EBITDA was $125.3 million, down 9% from the year-ago quarter. The adjusted EBITDA margin was 6.5%, down 70 basis points from second-quarter fiscal 2023.
Balance Sheet & Cash Flow
ABM Industries exited second-quarter fiscal 2024 with cash and cash equivalents of $60.7 million compared with $58 million at the end of the preceding quarter. The long-term debt (net) was $1.2 billion compared with $1.3 billion at the end of first-quarter fiscal 2024. Net cash generated by operating activities was $117 million for the quarter. The free cash flow amounted to $115.1 million.
FY24 Guidance
For fiscal 2024, ABM Industries raised its EPS guidance. The company expects adjusted EPS of $3.40-$3.50 compared with the $3.30-$3.45 mentioned previously. The mid-point ($3.45) of the raised guided range is greater than the Zacks Consensus Estimate for earnings of $3.37. The adjusted EBITDA margin is anticipated between 6.2% and 6.5%. Interest expenses are expected between $82 million and $86 million.
ABM currently carries a Zacks Rank #3 (Hold). You can see the complete list of today’s Zacks #1 Rank (Strong Buy) stocks here.
Earnings Snapshot of Peers
Waste Management Inc. WM reported mixed first-quarter 2024 results.
WM’s adjusted earnings per share of $1.8 surpassed the Zacks Consensus Estimate by 15.1% and improved 33.6% year over year. Total revenues of $5.2 billion missed the consensus estimate by a slight margin but increased 5.5% year over year.
Verisk Analytics Inc. VRSK reported impressive first-quarter 2024 results.
VRSK’s adjusted earnings (excluding 11 cents from non-recurring items) were $1.6 per share, beating the Zacks Consensus Estimate by 7.2% and increasing 26.4% from the year-ago quarter. Total revenues of $704 million surpassed the consensus estimate marginally and increased 8% year over year on a reported basis and 6.9% on an organic constant-currency basis.
Want the latest recommendations from Zacks Investment Research? Today, you can download 7 Best Stocks for the Next 30 Days. Click to get this free report
Waste Management, Inc. (WM) : Free Stock Analysis Report
ABM Industries Incorporated (ABM) : Free Stock Analysis Report
Verisk Analytics, Inc. (VRSK) : Free Stock Analysis Report
