
 Yahoo Finance
 Abercrombie & Fitch (NYSE:ANF) Is Looking To Continue Growing Its Returns On Capital
To find a multi-bagger stock, what are the underlying trends we should look for in a business? In a perfect world, we'd like to see a company investing more capital into its business and ideally the returns earned from that capital are also increasing. Ultimately, this demonstrates that it's a business that is reinvesting profits at increasing rates of return. So when we looked at Abercrombie & Fitch (NYSE:ANF) and its trend of ROCE, we really liked what we saw.
Return On Capital Employed (ROCE): What Is It?
For those that aren't sure what ROCE is, it measures the amount of pre-tax profits a company can generate from the capital employed in its business. The formula for this calculation on Abercrombie & Fitch is:
Return on Capital Employed = Earnings Before Interest and Tax (EBIT) ÷ (Total Assets - Current Liabilities)
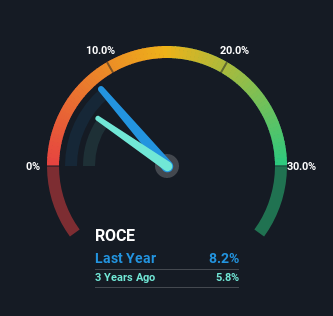
0.082 = US$146m ÷ (US$2.7b - US$959m) (Based on the trailing twelve months to July 2022).
Thus, Abercrombie & Fitch has an ROCE of 8.2%. Ultimately, that's a low return and it under-performs the Specialty Retail industry average of 17%.
See our latest analysis for Abercrombie & Fitch
In the above chart we have measured Abercrombie & Fitch's prior ROCE against its prior performance, but the future is arguably more important. If you'd like to see what analysts are forecasting going forward, you should check out our free report for Abercrombie & Fitch.
What The Trend Of ROCE Can Tell Us
Shareholders will be relieved that Abercrombie & Fitch has broken into profitability. The company was generating losses five years ago, but has managed to turn it around and as we saw earlier is now earning 8.2%, which is always encouraging. While returns have increased, the amount of capital employed by Abercrombie & Fitch has remained flat over the period. With no noticeable increase in capital employed, it's worth knowing what the company plans on doing going forward in regards to reinvesting and growing the business. So if you're looking for high growth, you'll want to see a business's capital employed also increasing.
For the record though, there was a noticeable increase in the company's current liabilities over the period, so we would attribute some of the ROCE growth to that. The current liabilities has increased to 35% of total assets, so the business is now more funded by the likes of its suppliers or short-term creditors. Keep an eye out for future increases because when the ratio of current liabilities to total assets gets particularly high, this can introduce some new risks for the business.
The Bottom Line
To sum it up, Abercrombie & Fitch is collecting higher returns from the same amount of capital, and that's impressive. Considering the stock has delivered 21% to its stockholders over the last five years, it may be fair to think that investors aren't fully aware of the promising trends yet. So with that in mind, we think the stock deserves further research.
If you'd like to know more about Abercrombie & Fitch, we've spotted 2 warning signs, and 1 of them is concerning.
If you want to search for solid companies with great earnings, check out this free list of companies with good balance sheets and impressive returns on equity.
Have feedback on this article? Concerned about the content? Get in touch with us directly. Alternatively, email editorial-team (at) simplywallst.com.
This article by Simply Wall St is general in nature. We provide commentary based on historical data and analyst forecasts only using an unbiased methodology and our articles are not intended to be financial advice. It does not constitute a recommendation to buy or sell any stock, and does not take account of your objectives, or your financial situation. We aim to bring you long-term focused analysis driven by fundamental data. Note that our analysis may not factor in the latest price-sensitive company announcements or qualitative material. Simply Wall St has no position in any stocks mentioned.
Join A Paid User Research Session
You’ll receive a US$30 Amazon Gift card for 1 hour of your time while helping us build better investing tools for the individual investors like yourself. Sign up here