
 Yahoo Finance
 With 63% ownership of the shares, ST Energy Transition I Ltd. (NYSE:STET) is heavily dominated by institutional owners
Key Insights
Significantly high institutional ownership implies ST Energy Transition I's stock price is sensitive to their trading actions
A total of 14 investors have a majority stake in the company with 51% ownership
Using data from company's past performance alongside ownership research, one can better assess the future performance of a company
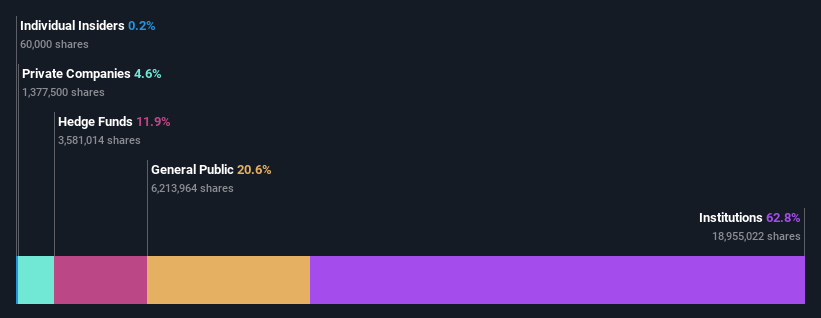
If you want to know who really controls ST Energy Transition I Ltd. (NYSE:STET), then you'll have to look at the makeup of its share registry. And the group that holds the biggest piece of the pie are institutions with 63% ownership. Put another way, the group faces the maximum upside potential (or downside risk).
Given the vast amount of money and research capacities at their disposal, institutional ownership tends to carry a lot of weight, especially with individual investors. Therefore, a good portion of institutional money invested in the company is usually a huge vote of confidence on its future.
In the chart below, we zoom in on the different ownership groups of ST Energy Transition I.
Check out our latest analysis for ST Energy Transition I
What Does The Institutional Ownership Tell Us About ST Energy Transition I?
Institutions typically measure themselves against a benchmark when reporting to their own investors, so they often become more enthusiastic about a stock once it's included in a major index. We would expect most companies to have some institutions on the register, especially if they are growing.
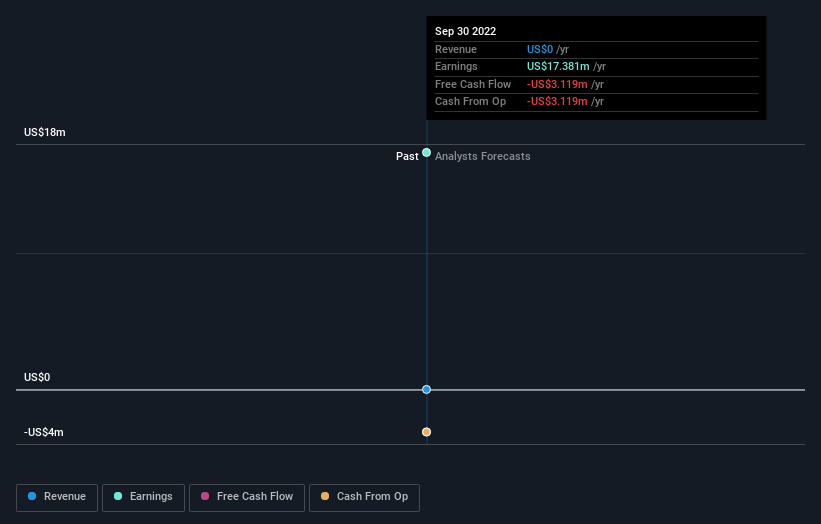
As you can see, institutional investors have a fair amount of stake in ST Energy Transition I. This suggests some credibility amongst professional investors. But we can't rely on that fact alone since institutions make bad investments sometimes, just like everyone does. It is not uncommon to see a big share price drop if two large institutional investors try to sell out of a stock at the same time. So it is worth checking the past earnings trajectory of ST Energy Transition I, (below). Of course, keep in mind that there are other factors to consider, too.
Since institutional investors own more than half the issued stock, the board will likely have to pay attention to their preferences. Our data indicates that hedge funds own 12% of ST Energy Transition I. That catches my attention because hedge funds sometimes try to influence management, or bring about changes that will create near term value for shareholders. Saba Capital Management, L.P. is currently the largest shareholder, with 6.1% of shares outstanding. Meanwhile, the second and third largest shareholders, hold 5.8% and 5.0%, of the shares outstanding, respectively.
Looking at the shareholder registry, we can see that 51% of the ownership is controlled by the top 14 shareholders, meaning that no single shareholder has a majority interest in the ownership.
While it makes sense to study institutional ownership data for a company, it also makes sense to study analyst sentiments to know which way the wind is blowing. We're not picking up on any analyst coverage of the stock at the moment, so the company is unlikely to be widely held.
Insider Ownership Of ST Energy Transition I
The definition of an insider can differ slightly between different countries, but members of the board of directors always count. Company management run the business, but the CEO will answer to the board, even if he or she is a member of it.
I generally consider insider ownership to be a good thing. However, on some occasions it makes it more difficult for other shareholders to hold the board accountable for decisions.
Our most recent data indicates that insiders own less than 1% of ST Energy Transition I Ltd.. But they may have an indirect interest through a corporate structure that we haven't picked up on. It has a market capitalization of just US$314m, and the board has only US$624k worth of shares in their own names. Many investors in smaller companies prefer to see the board more heavily invested. You can click here to see if those insiders have been buying or selling.
General Public Ownership
The general public-- including retail investors -- own 21% stake in the company, and hence can't easily be ignored. While this size of ownership may not be enough to sway a policy decision in their favour, they can still make a collective impact on company policies.
Private Company Ownership
It seems that Private Companies own 4.6%, of the ST Energy Transition I stock. It might be worth looking deeper into this. If related parties, such as insiders, have an interest in one of these private companies, that should be disclosed in the annual report. Private companies may also have a strategic interest in the company.
Next Steps:
I find it very interesting to look at who exactly owns a company. But to truly gain insight, we need to consider other information, too. Take risks for example - ST Energy Transition I has 4 warning signs (and 3 which are a bit concerning) we think you should know about.
Of course, you might find a fantastic investment by looking elsewhere. So take a peek at this free list of interesting companies.
NB: Figures in this article are calculated using data from the last twelve months, which refer to the 12-month period ending on the last date of the month the financial statement is dated. This may not be consistent with full year annual report figures.
Have feedback on this article? Concerned about the content? Get in touch with us directly. Alternatively, email editorial-team (at) simplywallst.com.
This article by Simply Wall St is general in nature. We provide commentary based on historical data and analyst forecasts only using an unbiased methodology and our articles are not intended to be financial advice. It does not constitute a recommendation to buy or sell any stock, and does not take account of your objectives, or your financial situation. We aim to bring you long-term focused analysis driven by fundamental data. Note that our analysis may not factor in the latest price-sensitive company announcements or qualitative material. Simply Wall St has no position in any stocks mentioned.
Join A Paid User Research Session
You’ll receive a US$30 Amazon Gift card for 1 hour of your time while helping us build better investing tools for the individual investors like yourself. Sign up here
