
 Yahoo Finance
 5.0% earnings growth over 3 years has not materialized into gains for Wendy's (NASDAQ:WEN) shareholders over that period
For many investors, the main point of stock picking is to generate higher returns than the overall market. But if you try your hand at stock picking, you risk returning less than the market. We regret to report that long term The Wendy's Company (NASDAQ:WEN) shareholders have had that experience, with the share price dropping 31% in three years, versus a market return of about 19%. And the ride hasn't got any smoother in recent times over the last year, with the price 25% lower in that time. More recently, the share price has dropped a further 14% in a month.
After losing 5.1% this past week, it's worth investigating the company's fundamentals to see what we can infer from past performance.
View our latest analysis for Wendy's
In his essay The Superinvestors of Graham-and-Doddsville Warren Buffett described how share prices do not always rationally reflect the value of a business. One flawed but reasonable way to assess how sentiment around a company has changed is to compare the earnings per share (EPS) with the share price.
Although the share price is down over three years, Wendy's actually managed to grow EPS by 16% per year in that time. Given the share price reaction, one might suspect that EPS is not a good guide to the business performance during the period (perhaps due to a one-off loss or gain). Alternatively, growth expectations may have been unreasonable in the past.
Since the change in EPS doesn't seem to correlate with the change in share price, it's worth taking a look at other metrics.
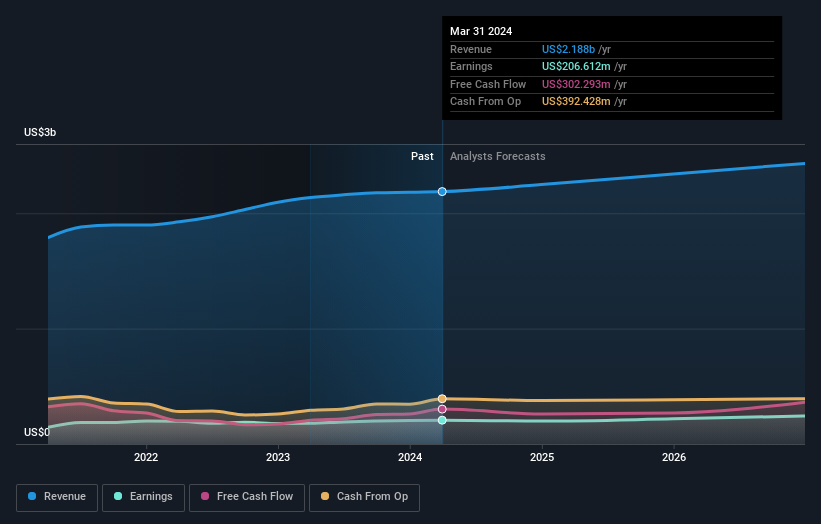
Given the healthiness of the dividend payments, we doubt that they've concerned the market. It's good to see that Wendy's has increased its revenue over the last three years. But it's not clear to us why the share price is down. It might be worth diving deeper into the fundamentals, lest an opportunity goes begging.
You can see below how earnings and revenue have changed over time (discover the exact values by clicking on the image).
Wendy's is well known by investors, and plenty of clever analysts have tried to predict the future profit levels. If you are thinking of buying or selling Wendy's stock, you should check out this free report showing analyst consensus estimates for future profits.
What About Dividends?
As well as measuring the share price return, investors should also consider the total shareholder return (TSR). The TSR incorporates the value of any spin-offs or discounted capital raisings, along with any dividends, based on the assumption that the dividends are reinvested. So for companies that pay a generous dividend, the TSR is often a lot higher than the share price return. We note that for Wendy's the TSR over the last 3 years was -23%, which is better than the share price return mentioned above. The dividends paid by the company have thusly boosted the total shareholder return.
A Different Perspective
Wendy's shareholders are down 21% for the year (even including dividends), but the market itself is up 23%. However, keep in mind that even the best stocks will sometimes underperform the market over a twelve month period. Unfortunately, last year's performance may indicate unresolved challenges, given that it was worse than the annualised loss of 0.5% over the last half decade. Generally speaking long term share price weakness can be a bad sign, though contrarian investors might want to research the stock in hope of a turnaround. It's always interesting to track share price performance over the longer term. But to understand Wendy's better, we need to consider many other factors. To that end, you should learn about the 3 warning signs we've spotted with Wendy's (including 1 which is concerning) .
If you are like me, then you will not want to miss this free list of undervalued small caps that insiders are buying.
Please note, the market returns quoted in this article reflect the market weighted average returns of stocks that currently trade on American exchanges.
Have feedback on this article? Concerned about the content? Get in touch with us directly. Alternatively, email editorial-team (at) simplywallst.com.
This article by Simply Wall St is general in nature. We provide commentary based on historical data and analyst forecasts only using an unbiased methodology and our articles are not intended to be financial advice. It does not constitute a recommendation to buy or sell any stock, and does not take account of your objectives, or your financial situation. We aim to bring you long-term focused analysis driven by fundamental data. Note that our analysis may not factor in the latest price-sensitive company announcements or qualitative material. Simply Wall St has no position in any stocks mentioned.
