
 Yahoo Finance
 These 4 Measures Indicate That CAE (TSE:CAE) Is Using Debt Extensively

Warren Buffett famously said, 'Volatility is far from synonymous with risk.' When we think about how risky a company is, we always like to look at its use of debt, since debt overload can lead to ruin. We note that CAE Inc. (TSE:CAE) does have debt on its balance sheet. But is this debt a concern to shareholders?
When Is Debt Dangerous?
Debt and other liabilities become risky for a business when it cannot easily fulfill those obligations, either with free cash flow or by raising capital at an attractive price. If things get really bad, the lenders can take control of the business. However, a more usual (but still expensive) situation is where a company must dilute shareholders at a cheap share price simply to get debt under control. Of course, the upside of debt is that it often represents cheap capital, especially when it replaces dilution in a company with the ability to reinvest at high rates of return. The first step when considering a company's debt levels is to consider its cash and debt together.
Check out our latest analysis for CAE
What Is CAE's Debt?
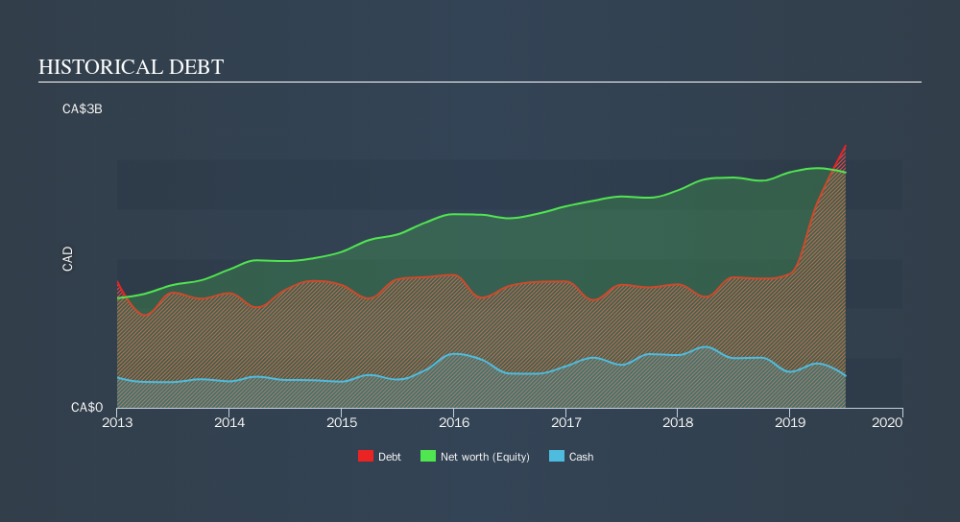
You can click the graphic below for the historical numbers, but it shows that as of June 2019 CAE had CA$2.38b of debt, an increase on CA$1.31b, over one year. However, it also had CA$322.0m in cash, and so its net debt is CA$2.05b.
A Look At CAE's Liabilities
The latest balance sheet data shows that CAE had liabilities of CA$1.77b due within a year, and liabilities of CA$3.28b falling due after that. On the other hand, it had cash of CA$322.0m and CA$1.12b worth of receivables due within a year. So its liabilities total CA$3.60b more than the combination of its cash and short-term receivables.
While this might seem like a lot, it is not so bad since CAE has a market capitalization of CA$8.96b, and so it could probably strengthen its balance sheet by raising capital if it needed to. But we definitely want to keep our eyes open to indications that its debt is bringing too much risk.
We measure a company's debt load relative to its earnings power by looking at its net debt divided by its earnings before interest, tax, depreciation, and amortization (EBITDA) and by calculating how easily its earnings before interest and tax (EBIT) cover its interest expense (interest cover). The advantage of this approach is that we take into account both the absolute quantum of debt (with net debt to EBITDA) and the actual interest expenses associated with that debt (with its interest cover ratio).
CAE has a debt to EBITDA ratio of 3.2 and its EBIT covered its interest expense 6.0 times. Taken together this implies that, while we wouldn't want to see debt levels rise, we think it can handle its current leverage. One way CAE could vanquish its debt would be if it stops borrowing more but continues to grow EBIT at around 13%, as it did over the last year. When analysing debt levels, the balance sheet is the obvious place to start. But it is future earnings, more than anything, that will determine CAE's ability to maintain a healthy balance sheet going forward. So if you're focused on the future you can check out this free report showing analyst profit forecasts.
But our final consideration is also important, because a company cannot pay debt with paper profits; it needs cold hard cash. So we clearly need to look at whether that EBIT is leading to corresponding free cash flow. Over the last three years, CAE reported free cash flow worth 18% of its EBIT, which is really quite low. That limp level of cash conversion undermines its ability to manage and pay down debt.
Our View
Neither CAE's ability to convert EBIT to free cash flow nor its net debt to EBITDA gave us confidence in its ability to take on more debt. But we do take some comfort from its EBIT growth rate. Looking at all the angles mentioned above, it does seem to us that CAE is a somewhat risky investment as a result of its debt. That's not necessarily a bad thing, since leverage can boost returns on equity, but it is something to be aware of. In light of our reservations about the company's balance sheet, it seems sensible to check if insiders have been selling shares recently.
At the end of the day, it's often better to focus on companies that are free from net debt. You can access our special list of such companies (all with a track record of profit growth). It's free.
We aim to bring you long-term focused research analysis driven by fundamental data. Note that our analysis may not factor in the latest price-sensitive company announcements or qualitative material.
If you spot an error that warrants correction, please contact the editor at editorial-team@simplywallst.com. This article by Simply Wall St is general in nature. It does not constitute a recommendation to buy or sell any stock, and does not take account of your objectives, or your financial situation. Simply Wall St has no position in the stocks mentioned. Thank you for reading.
