
 Yahoo Finance
 4 different ways of looking at the exact same economy
Stocks climbed last week, with the S&P 500 gaining 1.8% to close at 4,783.83. The index is now up 0.3% year to date, up 33.7% from its October 12, 2022 closing low of 3,577.03 and down 0.3% from its January 3, 2022 record closing high of 4,796.56.
Often times, those discussing what’s driving the stock market will appear in conflict with those discussing what’s driving the economy. And sometimes, those discussing what’s driving the economy will appear in conflict with each other.
These diverging views will happen even though everyone is in total agreement about the validity of the measurable data they’re citing.
How is this possible?
I think we can begin to disentangle what’s going on by thinking of people as wearing one of many different hats. There are at least four important hats that are worth a closer look.
The hard data economy hat 🪖
Hard data is anything that reflects quantifiable and observable behavior — stuff that is actually happening. Think job creation, wage growth, industrial output, retail sales, government spending, imports and exports, and consumer prices. There are receipts for all these things.
These include metrics that help us determine whether or not the economy is in expansion or recession.
We may actually need to divide this hat into two hats depending on how you measure economic activity. Some say the direction of the economy is reflected in two quarters’ worth of GDP, which relies strictly on monetary values of activity. Others go by the official NBER definition of activity, which considers non-monetary metrics like changes in employment.
While the GDP-oriented economy observers have perspectives that differ from the NBER-oriented observers, they at least agree that the activity is based on hard measures. It’s just a matter of how they weight those measures.
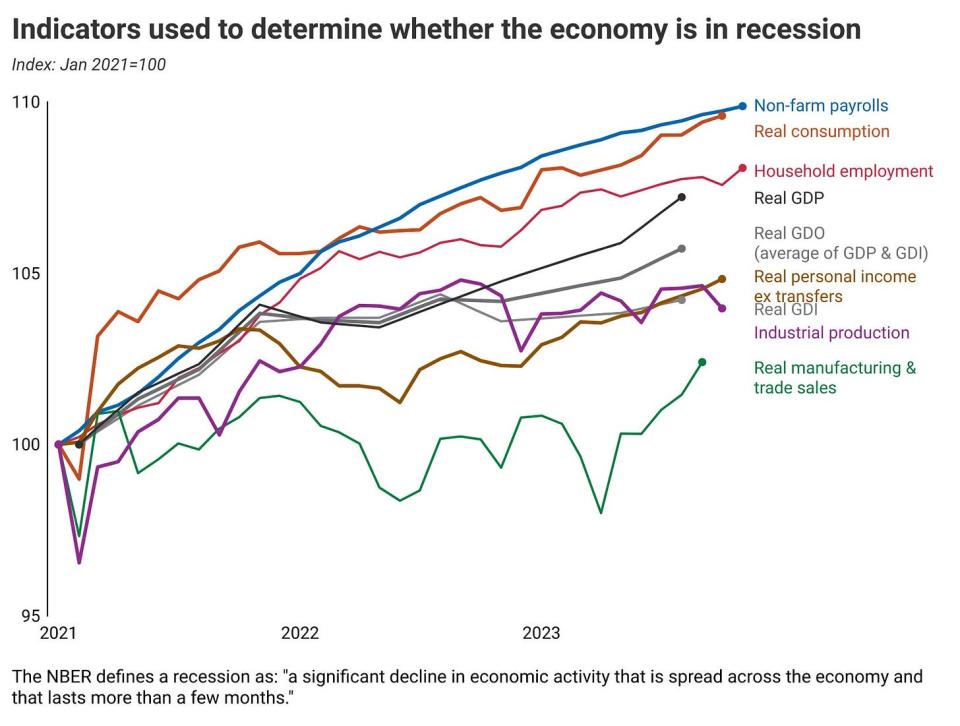
Generally speaking, hard data metrics have been favorable — mostly reflecting a growing economy.
For more, read: The economy has gone from very hot to pretty good 😎 and You call this a recession? 🤨
The soft data economy hat 👒
Soft data is generated through surveys of consumers and business operators expressing their opinions, feelings and expectations about things like job security, financial health, inflation, future business activity, and labor quality. They’re measurements of stuff people feel is happening or feel will happen.
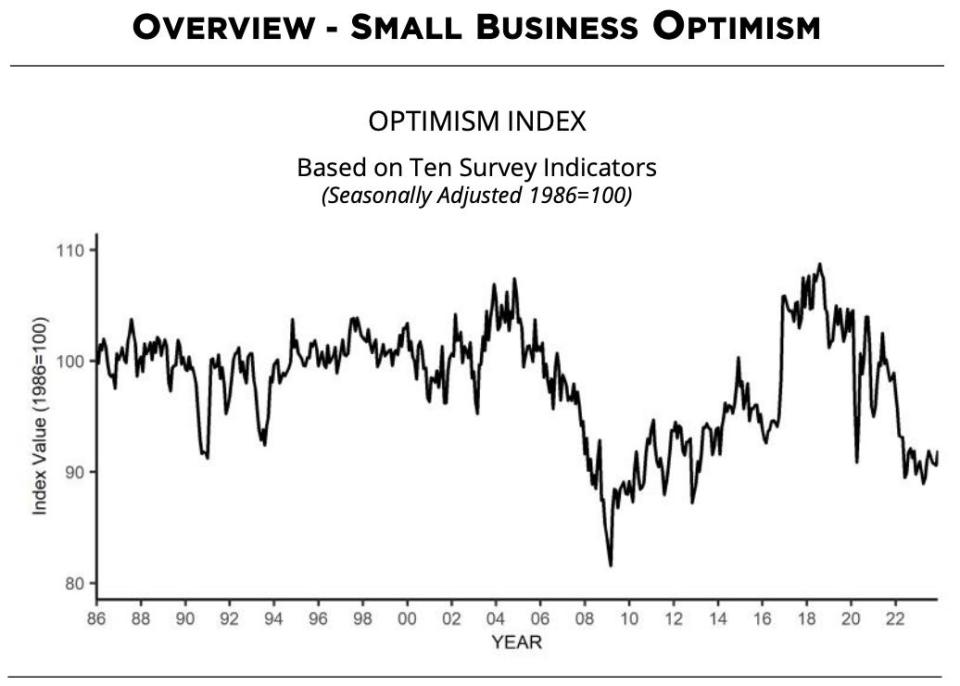
Popular reports capturing soft data include the New York Fed’s Survey of Consumer Expectations, the ISM’s Manufacturing PMI, the NFIB’s Small Business Optimism Index, and the University of Michigan’s Surveys of Consumers.
Soft data reflect the vibes, as Kyla Scanlon would say.
Recently — despite robust hard economic data — the economic vibes haven’t been great, as consumer and business sentiment have spent most of the past two years in the dumps.
Does this mean we should dismiss the sentiment data?
Of course not.
What good is it to have lots of money and to buy everything you want if you’re more unhappy than you were when you had less money and less stuff?
For more, read: A bullish contradiction 🛍 and What businesses do > what businesses say 🙊
The stock market hat 🎩
In the short run, news about the hard and soft economic data can move the stock market. Technical factors in the markets will also move prices in the near term. Pretty much anything you imagine can affect trader decisions and investor sentiment, which in turn affects the markets over short periods of time.
But in the long run, the most important driver of stock prices is earnings.
As I explained in TKer Stock Market Truth No. 2, "News about the economy or policy moves markets to the degree they are expected to impact earnings. Earnings (a.k.a. profits) are why you invest in companies."
When thinking about stocks over the long term, soft economic metrics matter to the degree they affect hard economic metrics. And hard economic metrics matter to the degree they affect earnings.
This can get complicated, because it’s certainly possible to have economic recessions that aren’t associated with earnings recessions.
As explained in the Nov. 29 TKer, 2024 could be a year when the stock market performs considerably better than the economy due to contrasting exposures to the goods and services sectors. Improving economic metrics won’t always coincide with improving earnings, and vice versa.
Earnings, for their part, have been trending higher and are expected to keep going higher, which helps explain why stock prices are near record highs. Analysts expect double-digit earnings growth in 2024 and 2025.
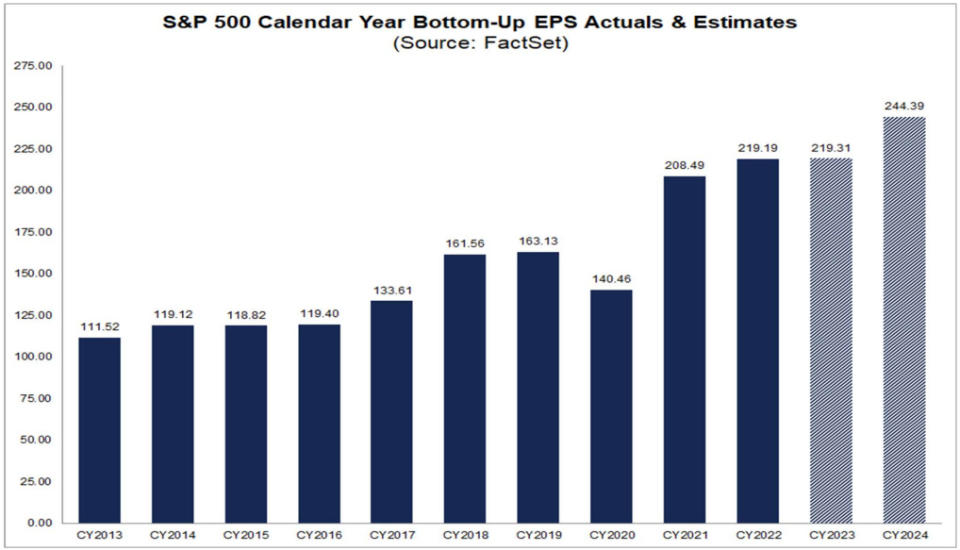
And when earnings are going up, the stock market usually goes up.
For more, read: Earnings are the most important driver of stock prices💰
The biased hat 🧢
Unfortunately, there are many people and entities who are unable to look at data objectively. And so whatever the development may be, they’ll figure out a way to spin it so the story confirms their priors.
This is often the case for permabears, who’ll spin anything negatively, and permabulls, who’ll spin anything positively.
There are also some business news reporters and outlets who are more concerned about getting clicks and engagement on their stories than they are about reporting the data fairly. And so while the balance of data may be favorable, you may get outsized coverage of unfavorable cherry-picked data if it attracts reader interest.
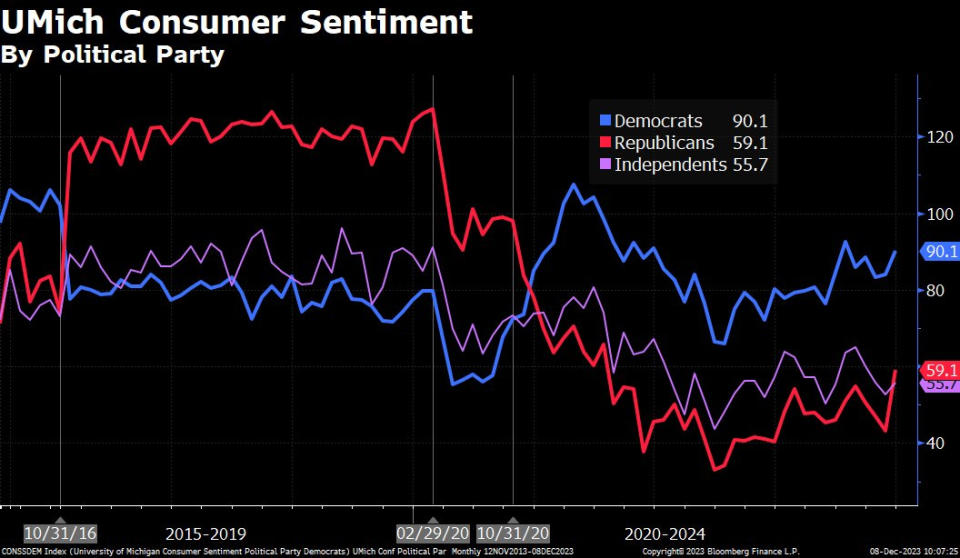
Political persuasions can play a huge role in how people view data. If you’re in office and you’re looking to get re-elected, then you’ll probably spin developments in your favor. If you’re not in office but seeking to get elected, then you’ll have an incentive to spin the data unfavorably so the incumbent looks bad.
As the University of Michigan’s consumer sentiment data shows, views on the economy contrast considerably depending on political affiliations.
To be fair, biased views and balanced views aren’t totally mutually exclusive. In many cases, their conclusions may be in line.
But in other cases, biased folks will turn a blind eye to developments that undermine their priors, and that can be dangerous for anyone listening.
Beware the motivations of those communicating information.
Fore more, read: 11 ways cynics argue any news is bad news 👎, A 5-step guide to processing ambiguous news 📋, Is good economic news really all that surprising? 📰, and Beware alarming business stories that get a lot of news coverage 🗞️
Zooming out 🔭
So, how’s the economy?
Well, it depends on whom you ask.
The hard data folks will likely tell you the economy is growing, but it appears to be cooling. Many warn a recession could be around the corner.
The soft data folks will probably tell you the economic vibes aren’t good, but there are signs they’re improving.
The stock market folks might tell you economic growth may be cooling — but in a way that should allow big companies to report healthy earnings growth, which should help send stock prices higher.
However Democrats feel, you can bet Republicans feel worse.
Each group may have different tones, but they’re not necessarily in disagreement about the measurable data.
FULL DISCLOSURE: TKer tends to wear the stock market hat.
-
Related from TKer:
Reviewing the macro crosscurrents 🔀
There were a few notable data points and macroeconomic developments from last week to consider:
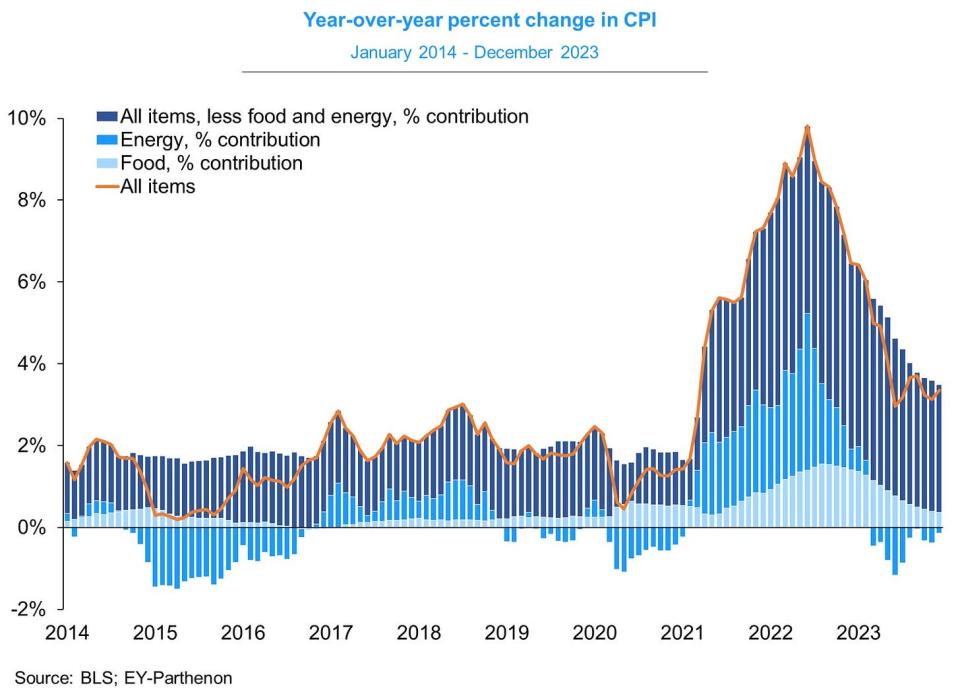
👍 Inflation is cool-ish. The Consumer Price Index (CPI) in December was up 3.4% from a year ago. This was up from the 3.1% rate in November. Adjusted for food and energy prices, core CPI was up 3.9%, the lowest since May 2021.
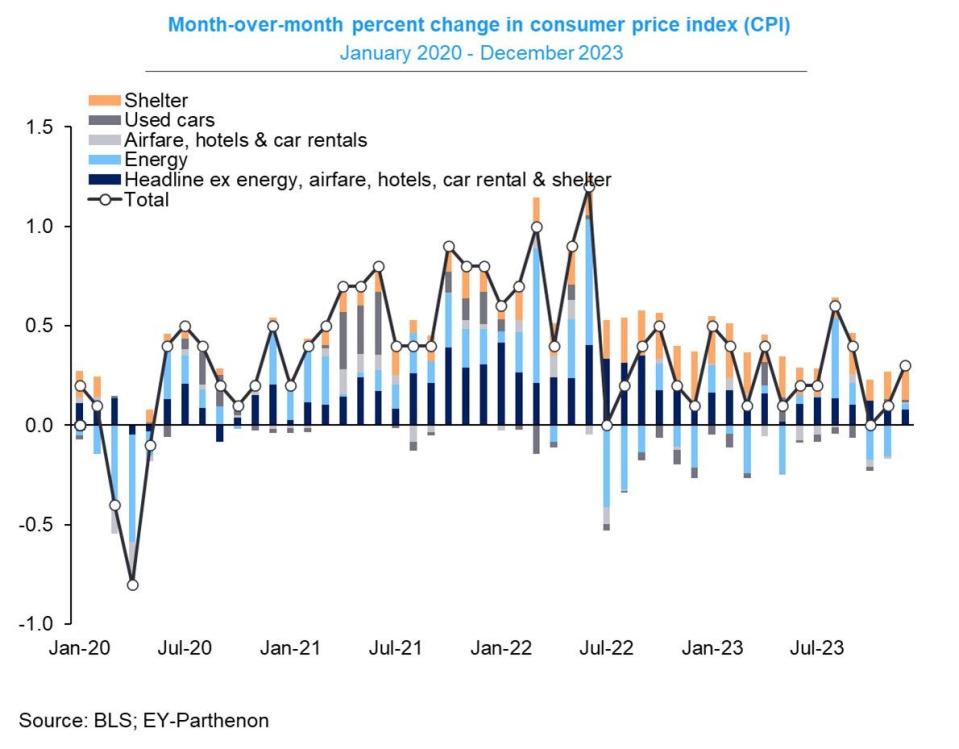
On a month-over-month basis, CPI was up just 0.3%. Core CPI was up a modest 0.3%.
If you annualize the three-month trend in the monthly figures — a reflection of the short-term trend in prices — CPI was rising at a 1.8% rate and core CPI was climbing at a 3.3% rate.
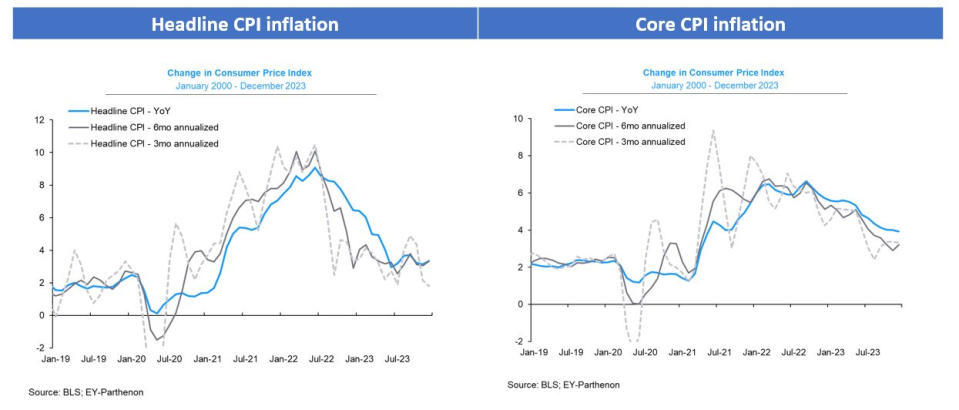
While many broad measures of inflation continue to hover above the Fed’s target rate of 2%, they are way down from peak levels in the summer of 2022. And the trend suggests they could continue to move lower.
For more, read: Inflation: Is the worst behind us? 🎈
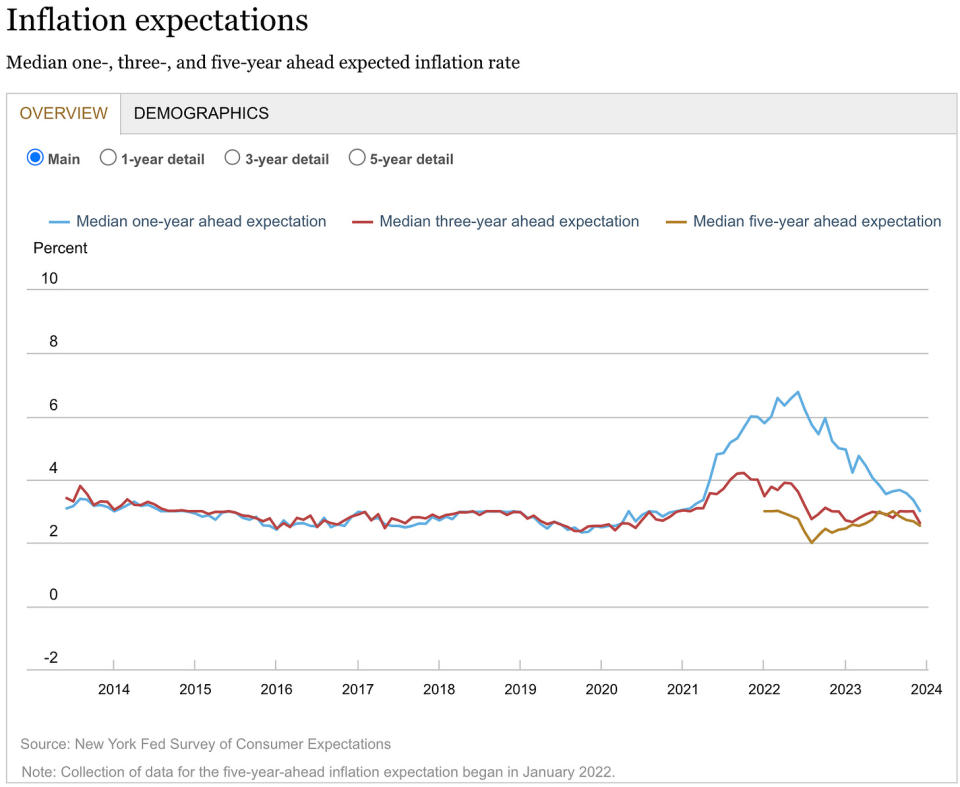
👍 Inflation expectations improve. From the New York Fed’s December Survey of Consumer Expectations: "Median inflation expectations declined at all horizons, falling to 3.0% from 3.4% at the one-year ahead horizon, to 2.6% from 3.0% at the three-year ahead horizon, and to 2.5% from 2.7% at the five-year ahead horizon. Median inflation expectations at the one-year ahead horizon reached the lowest level recorded since January 2021."
For more, read: The end of the inflation crisis 🎈
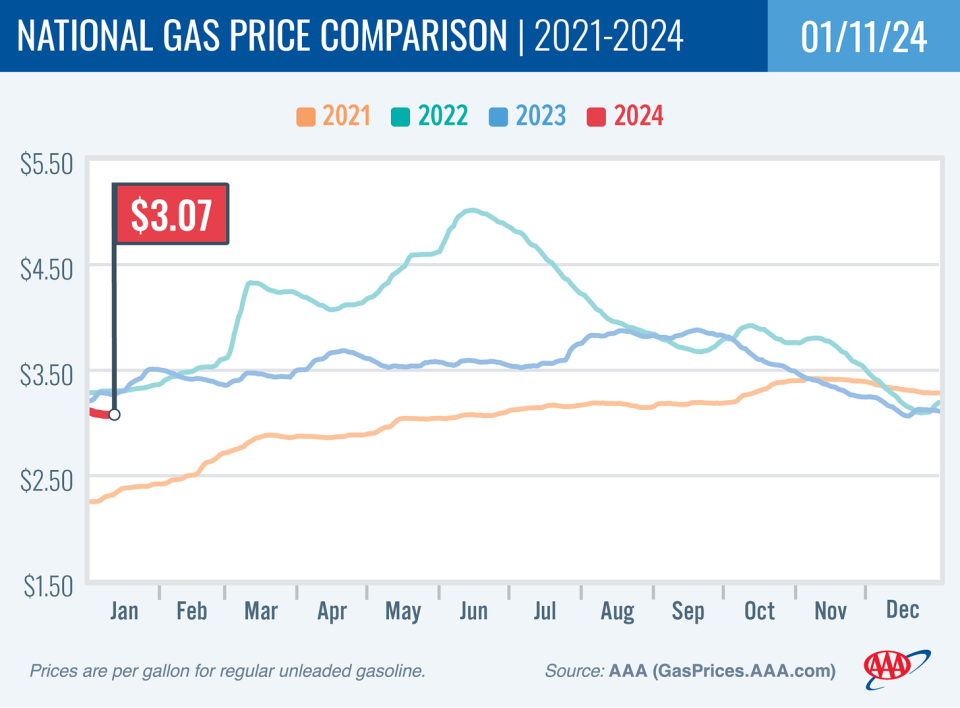
⛽️ Gas prices continue to fall. From AAA: "The national average for a gallon of gas barely budged since last week, falling two cents to $3.07. The primary reason appears to be rather humdrum numbers for the cost of oil and gasoline demand. … According to new data from the Energy Information Administration (EIA), gas demand increased from 7.95 to 8.33 million b/d last week. Meanwhile, total domestic gasoline stocks increased significantly by 8 million bbl to 245 million bbl. The slight uptick in demand has limited pump price drops, causing the national average to stagnate. However, if oil prices continue to drop, drivers could continue to see pump prices trickle lower."
For more on energy prices, read: The other side of the surging oil price story 🛢
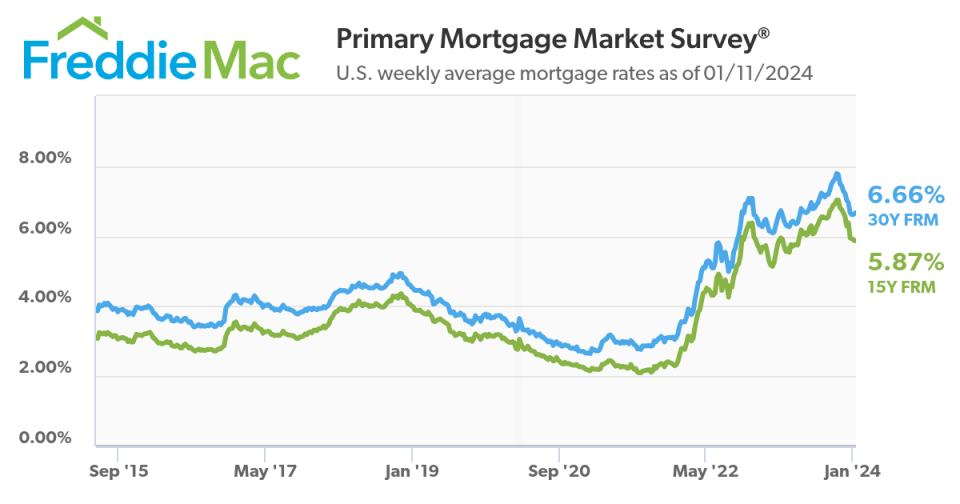
🏠 Mortgage rates tick up. According to Freddie Mac, the average 30-year fixed-rate mortgage rose to 6.66% from 6.62% the week prior. From Freddie Mac: "Mortgage rates have not moved materially over the last three weeks and remain in the mid-six percent range, which has marginally increased homebuyer demand. Even this slight uptick in demand, combined with inventory that remains tight, continues to cause prices to rise faster than incomes, meaning affordability remains a major headwind for buyers. Potential homebuyers should look closely at existing state and local resources, such as down payment assistance programs, which can considerably help defray closing costs."
For more on home prices, read: Why home prices and rents are creating all sorts of confusion about inflation 😖
📈 Small business optimism improves. The NFIB’s Small Business Optimism Index ticked higher in December.
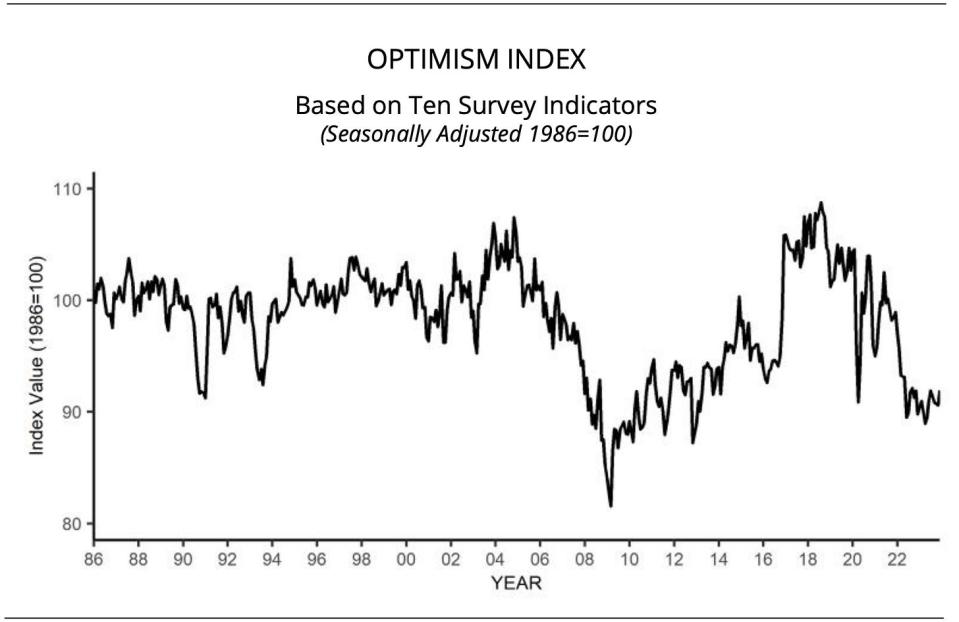
Importantly, the more tangible "hard" components of the index continue to hold up much better than the more sentiment-oriented "soft" components.

Keep in mind that during times of stress, soft data tends to be more exaggerated than actual hard data.
For more on this, read: What businesses do > what businesses say 🙊 and Sentiment: Finally a vibe-spansion? 🙃
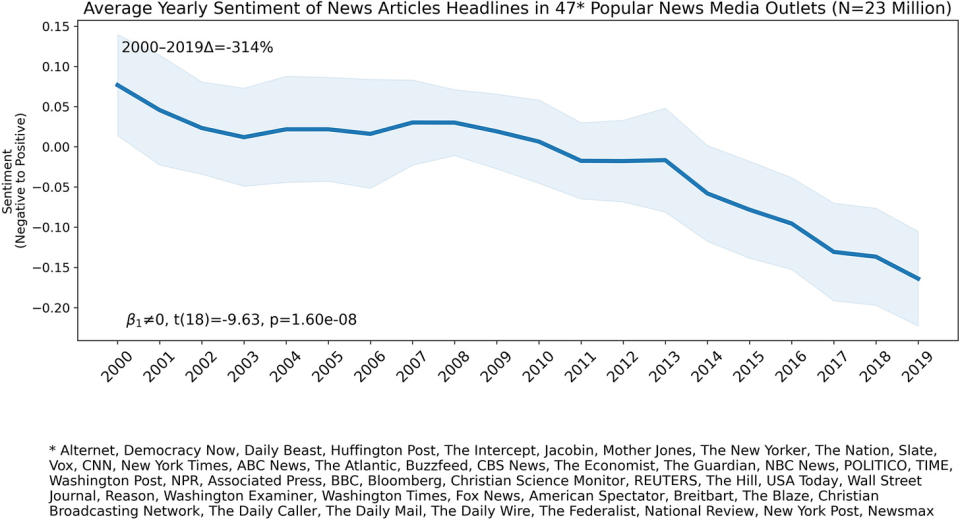
📰 News coverage of the economy has been negative. Here’s FT’s Robin Wigglesworth on a recent study of the news: "After scouring 1bn newspaper articles over 170 years (ca 95 times larger than the total number of English-language Wikipedia entries combined) some researchers have found a remarkable 50 year collapse in economic sentiment."
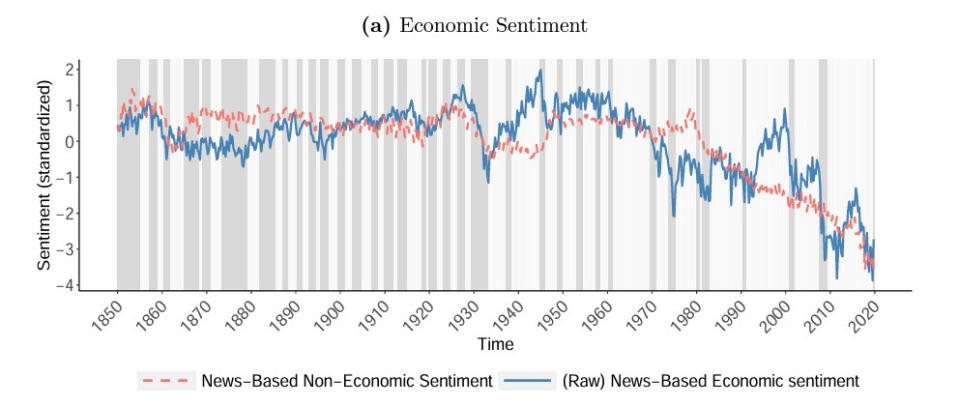
For whatever reason, news coverage of the economy has slanted negatively even during periods of economic prosperity.
For more, read: Is good economic news really all that surprising? 📰 , A 5-step guide to processing ambiguous news 📋, and Beware alarming business stories that get a lot of news coverage 🗞️
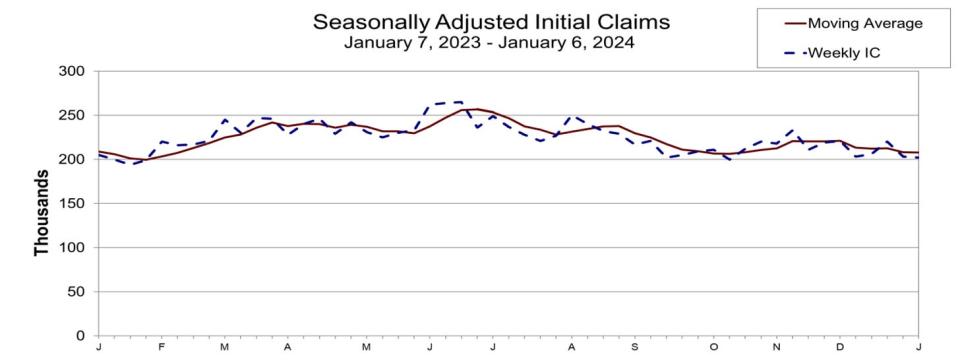
💼 Unemployment claims fall. Initial claims for unemployment benefits fell to 202,000 during the week ending January 6, down from 203,000 the week prior. While this is up from a September 2022 low of 182,000, it continues to trend at levels associated with economic growth.
For more on the labor market, read: The hot but cooling labor market in 16 charts 📊🔥🧊 and Labor market: How cool will it get? 🥶
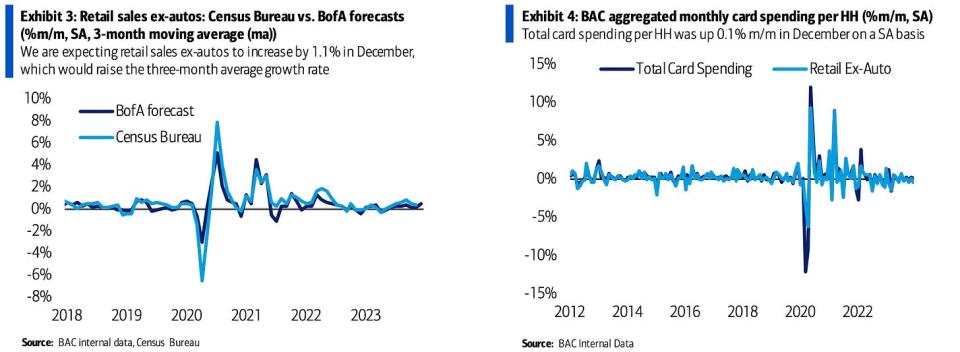
💳 Spending is holding up, according to card data. From BofA: "Total BAC card spending per HH was up 0.2% y/y in Dec. We expect 1.1% & 0.7% gains in ex-auto & core control retail sales. However, we see a wide range of outcomes for retail sales. Seasonal adjustments could swamp the signal from the data. If the Dec print is outsized in either direction, there should be payback in Jan/Feb. Stepping back, spending looks healthy."
For more on what’s driving spending, read: People have money 💵
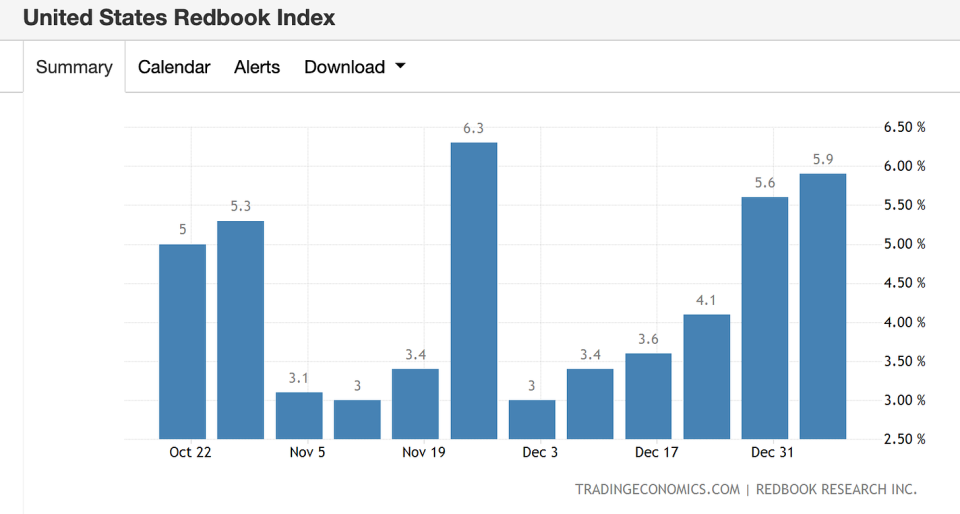
🛍️ People are shopping. According to Redbook (via Bob Elliott), chain store retail sales rose 5.9% during the week ending January 9.
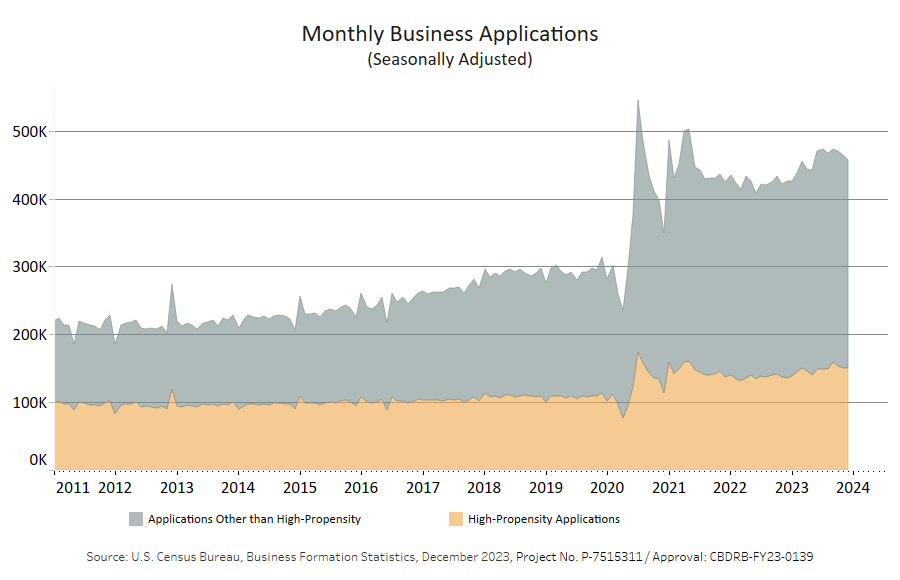
🍾 The entrepreneurial spirit is alive. Small business applications, while down slightly from the previous month, remain well above prepandemic levels. From the Census Bureau: "December 2023 Business Applications were 457,316, down 1.3% (seasonally adjusted) from November. Of those, 149,973 were High-Propensity Business Applications."
💰 Corporate finances look strong. From BofA (via Mike Zaccardi): "Higher interest rates are intended to slow the economy, in part, by making it more expensive for companies to borrow capital for expansion and investment. But after one of the fast and most aggressive rate hiking cycles in history, the number of firms declaring bankruptcy was the 2nd lowest in modern history. Note that corporate interest expenses are just 7% of profits, the most favorable level since 1957."
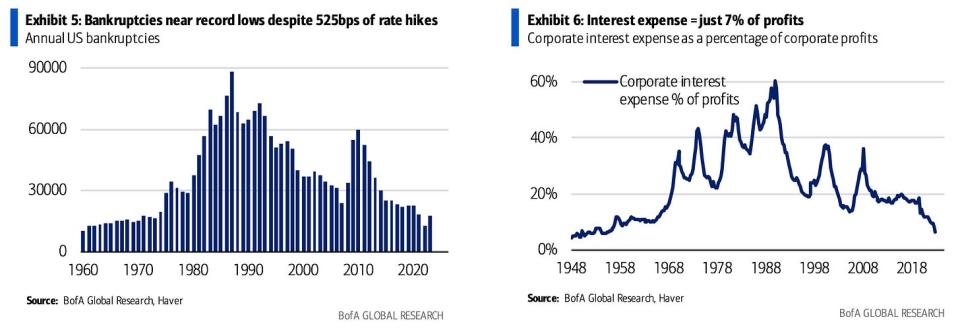
For more on corporate financial strength, read: Why higher interest rates haven't crushed corporate profits 🤔
📈 Near-term GDP growth estimates look good. The Atlanta Fed’s GDPNow model sees real GDP growth climbing at a 2.2% rate in Q4.
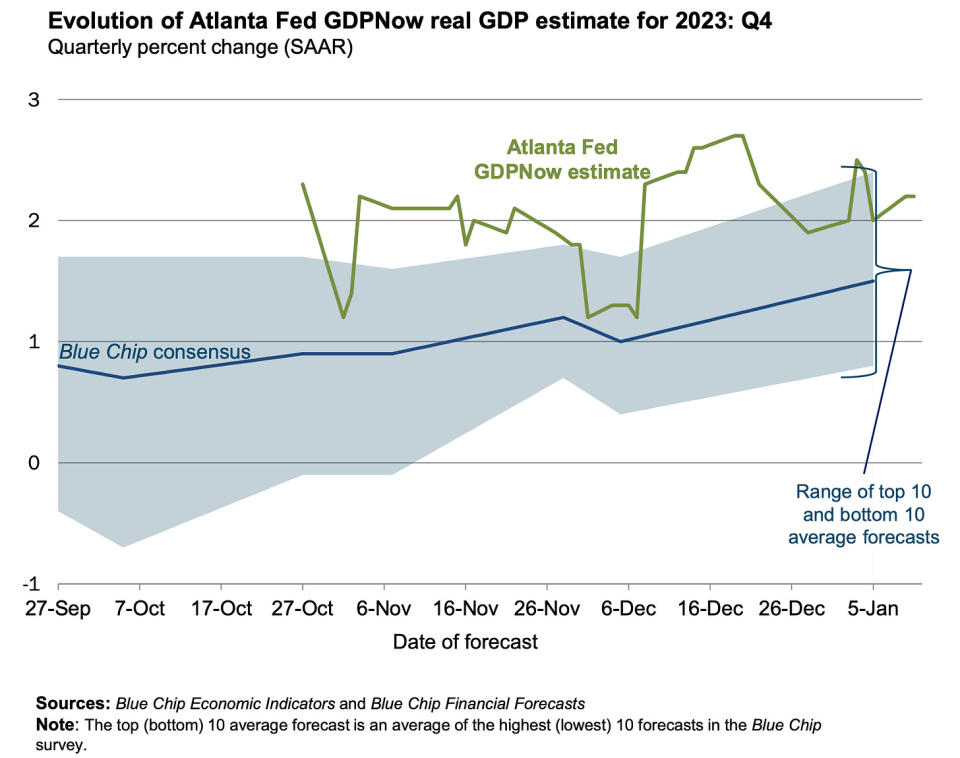
For more on the forces bolstering economic growth, read: 9 reasons to be optimistic about the economy and markets 💪 and Economic growth: Slowdown, recession, or something else? 🇺🇸
Putting it all together 🤔
We continue to get evidence that we are experiencing a bullish "Goldilocks" soft landing scenario where inflation cools to manageable levels without the economy having to sink into recession.
This comes as the Federal Reserve continues to employ very tight monetary policy in its ongoing effort to bring inflation down. While it’s true that the Fed has taken a less hawkish tone in 2023 than in 2022, and that most economists agree that the final interest rate hike of the cycle has either already happened or is near, inflation still has to cool more and stay cool for a little while before the central bank is comfortable with price stability.
So we should expect the central bank to keep monetary policy tight, which means we should be prepared for tight financial conditions (e.g., higher interest rates, tighter lending standards, and lower stock valuations) to linger. All this means monetary policy will be unfriendly to markets for the time being, and the risk the economy slips into a recession will be relatively elevated.
At the same time, we also know that stocks are discounting mechanisms — meaning that prices will have bottomed before the Fed signals a major dovish turn in monetary policy.
Also, it’s important to remember that while recession risks may be elevated, consumers are coming from a very strong financial position. Unemployed people are getting jobs, and those with jobs are getting raises.
Similarly, business finances are healthy as many corporations locked in low interest rates on their debt in recent years. Even as the threat of higher debt servicing costs looms, elevated profit margins give corporations room to absorb higher costs.
At this point, any downturn is unlikely to turn into economic calamity given that the financial health of consumers and businesses remains very strong.
And as always, long-term investors should remember that recessions and bear markets are just part of the deal when you enter the stock market with the aim of generating long-term returns. While markets have had a pretty rough couple of years, the long-run outlook for stocks remains positive.
