
 Yahoo Finance
 The 4.0% return this week takes Franco-Nevada's (TSE:FNV) shareholders five-year gains to 85%
Stock pickers are generally looking for stocks that will outperform the broader market. And in our experience, buying the right stocks can give your wealth a significant boost. To wit, the Franco-Nevada share price has climbed 76% in five years, easily topping the market return of 32% (ignoring dividends).
Since it's been a strong week for Franco-Nevada shareholders, let's have a look at trend of the longer term fundamentals.
See our latest analysis for Franco-Nevada
To quote Buffett, 'Ships will sail around the world but the Flat Earth Society will flourish. There will continue to be wide discrepancies between price and value in the marketplace...' One flawed but reasonable way to assess how sentiment around a company has changed is to compare the earnings per share (EPS) with the share price.
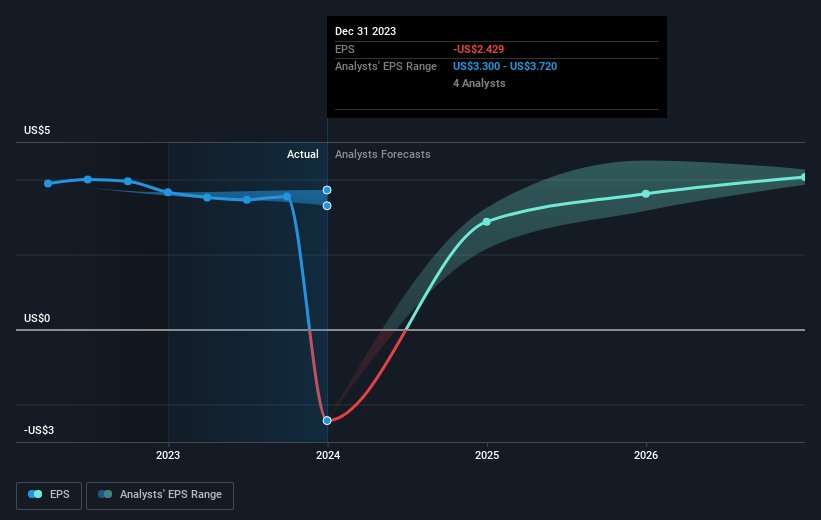
Over half a decade, Franco-Nevada managed to grow its earnings per share at 17% a year. The EPS growth is more impressive than the yearly share price gain of 12% over the same period. So one could conclude that the broader market has become more cautious towards the stock.
The image below shows how EPS has tracked over time (if you click on the image you can see greater detail).
We're pleased to report that the CEO is remunerated more modestly than most CEOs at similarly capitalized companies. But while CEO remuneration is always worth checking, the really important question is whether the company can grow earnings going forward. This free interactive report on Franco-Nevada's earnings, revenue and cash flow is a great place to start, if you want to investigate the stock further.
What About Dividends?
As well as measuring the share price return, investors should also consider the total shareholder return (TSR). The TSR incorporates the value of any spin-offs or discounted capital raisings, along with any dividends, based on the assumption that the dividends are reinvested. It's fair to say that the TSR gives a more complete picture for stocks that pay a dividend. We note that for Franco-Nevada the TSR over the last 5 years was 85%, which is better than the share price return mentioned above. The dividends paid by the company have thusly boosted the total shareholder return.
A Different Perspective
Franco-Nevada shareholders are down 18% for the year (even including dividends), but the market itself is up 7.6%. However, keep in mind that even the best stocks will sometimes underperform the market over a twelve month period. Longer term investors wouldn't be so upset, since they would have made 13%, each year, over five years. It could be that the recent sell-off is an opportunity, so it may be worth checking the fundamental data for signs of a long term growth trend. If you would like to research Franco-Nevada in more detail then you might want to take a look at whether insiders have been buying or selling shares in the company.
Of course, you might find a fantastic investment by looking elsewhere. So take a peek at this free list of companies we expect will grow earnings.
Please note, the market returns quoted in this article reflect the market weighted average returns of stocks that currently trade on Canadian exchanges.
Have feedback on this article? Concerned about the content? Get in touch with us directly. Alternatively, email editorial-team (at) simplywallst.com.
This article by Simply Wall St is general in nature. We provide commentary based on historical data and analyst forecasts only using an unbiased methodology and our articles are not intended to be financial advice. It does not constitute a recommendation to buy or sell any stock, and does not take account of your objectives, or your financial situation. We aim to bring you long-term focused analysis driven by fundamental data. Note that our analysis may not factor in the latest price-sensitive company announcements or qualitative material. Simply Wall St has no position in any stocks mentioned.
