
 Yahoo Finance
 3 truths about stock market volatility

Ultra-high levels of volatility aren’t exactly caused by economic fundamentals. That’s one of the lessons Bernstein analysts uncovered from examining 119 years (yes, that long) of stock market data.

Here are three takeaways on volatility from Bernstein’s Philipp Carlsson-Szlezak and Paul Swartz:
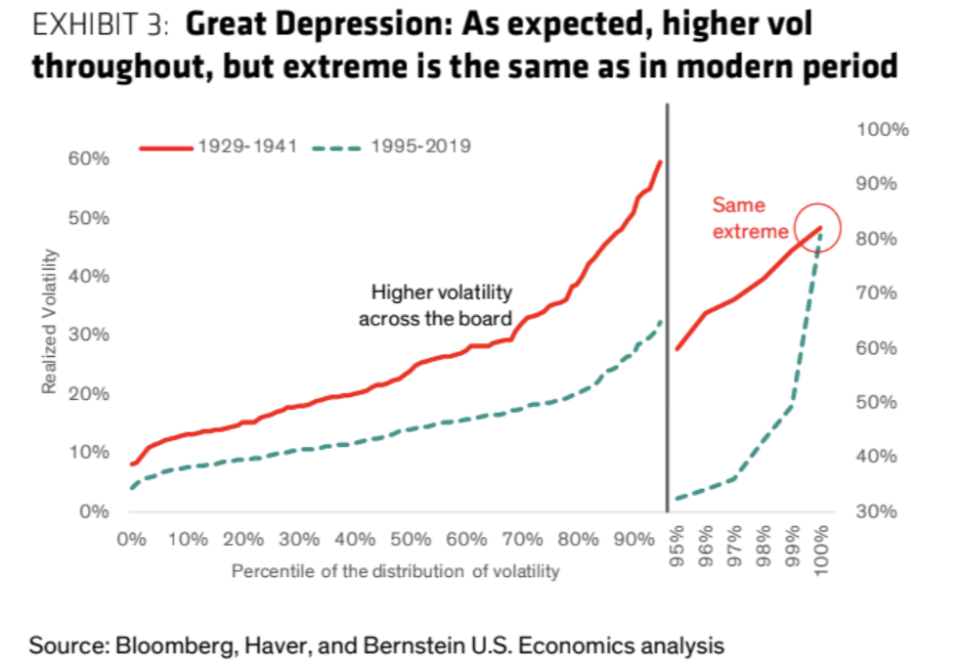
1. Extreme volatility isn’t tied to economic fundamentals
Extreme volatility levels in October 1929 were similar to October 2008, even though the economy was worse in 1929.
“This suggests that the worst volatility is not made any worse by depression conditions,” they noted. “The worst equity volatility is about banking stability, liquidity, panic, forced selling – not simply the fundamentals of the economy that were that much worse in the Depression era.”
2. Geopolitical issues don’t always guarantee elevated volatility
From 1942 to 1965, during which there were multiple wars and President John F. Kennedy was assassinated, average realized volatility was only 11%.
“Geopolitics matters but is given outsized attention when talking about drivers of volatility,” the analysts wrote.
They say a healthy financial system was the driver of low volatility in the stock market.
“The 1942-1965 period benefited from a healthy banking system (less leverage), the Bretton Woods system (stable foreign exchange rate), and a robust elastic investor class,” they noted.
3. Low volatility can exist with poor economic fundamentals
Bernstein next analyzed the “high inflation” era from 1966 to 1994 and found that average realized stock market volatility was low — at only 13%.
Yet, the economy was grappling with high inflation for a large part of this period. Remember the 14% 10-year Treasury yield in the early 1980s?
Once again, a strong financial system drove low volatility.
“The ‘bad macro’ era of the 70s and 80s is offset by a healthier (but weakening – e.g. 1987 [stock market crash]) financial ecosystem,” they noted.
-
Read the latest financial and business news from Yahoo Finance
Scott Gamm is a reporter at Yahoo Finance. Follow him on Twitter @ScottGamm.
More from Scott:
The earnings picture for 2019 is showing more signs of deterioration
The next rate cut is unlikely to be caused by weak growth, economist explains
What the plunging 10-year Treasury yield says about the economy and stock market
Why one top strategist is bullish on tech even with lingering trade worries
Follow Yahoo Finance on Twitter, Facebook, Instagram, Flipboard, LinkedIn, and reddit.
