
 Yahoo Finance
 3 Reasons to Not Chase Equities Here
Investing legend Jesse Livermore once said,“There is a time to go long, a time to go short, and a time to go fishing.” Based on the market’s excess bullish sentiment, seasonality, and earnings reactions, it may be a time to go fishing. Below, I will dive into each:
Market Sentiment is Running Hot
Sentiment can be a valuable tool for investors because it provides insights into the collective emotions and psychology of investors. Because the market is bent on fooling the masses, investors can use sentiment indicators as contrarian indicators. In other words, when sentiment gets pulled too far in one direction, markets are likely to mean-revert. Two of the most popular sentiment indicators are currently showing excessive bullishness:
The CNN Fear & Greed Index
The CNN Fear and Greed Index uses a combination of seven different indicators to gauge market sentiment, including stock price momentum, stock price strength, breadth, market volatility, put/call ratio, safe-haven demand, and junk demand. The indicator gauges market sentiment from extreme fear to extreme greed and everything in between. The “greed” reading is currently at extreme levels and is hovering near 52-week highs.
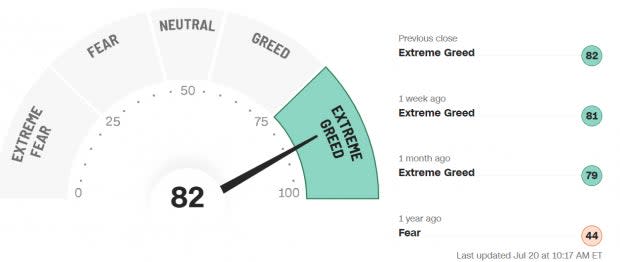
Image Source: CNN
The American Association of Individual Investors (AAII) Sentiment Indicator
The AAII Sentiment indicator measures the sentiment and emotions of individual investors. Investors who participate in the survey can choose a bullish, bearish, or neutral stance. The AAII Sentiment Survey showed bullish sentiment soar to 50% from last week’s 41% reading. Meanwhile, bears plunged to 21.5% from 25.9%. The difference between bullish and bearish sentiment is one of the largest in history.

Image Source: AAII
July Seasonality
Seasonality refers to the market’s tendency to exhibit a recurring pattern or behavior at specific times of the year. On average, the S&P 500 Index gains a little bit more than a percent in July. However, the S&P’s gains are usually concentrated in the first half of the month and typically top out right about now.
Good News Priced In?
Last night, two of the leading stocks delivered outstanding results. Netflix (NFLX), the world’s largest streaming service, recorded its best quarter of subscriber growth since 2020. Meanwhile, Tesla (TSLA), the leading EV manufacturer, recorded record revenue of $24.9 billion and produced a positive earnings surprise for its tenth straight quarter.
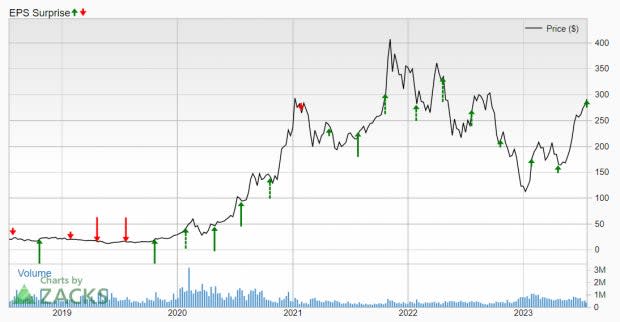
Image Source: Zacks Investment Research
Despite the impressive results, Thursday’s price action in the two stocks shows that the positive news is already baked into shares.
Want the latest recommendations from Zacks Investment Research? Today, you can download 7 Best Stocks for the Next 30 Days. Click to get this free report
Netflix, Inc. (NFLX) : Free Stock Analysis Report
Tesla, Inc. (TSLA) : Free Stock Analysis Report
