
 Yahoo Finance
 With A 3.7% Return On Equity, Is STINAG Stuttgart Invest AG (FRA:STG) A Quality Stock?
One of the best investments we can make is in our own knowledge and skill set. With that in mind, this article will work through how we can use Return On Equity (ROE) to better understand a business. We'll use ROE to examine STINAG Stuttgart Invest AG (FRA:STG), by way of a worked example.
Return on equity or ROE is an important factor to be considered by a shareholder because it tells them how effectively their capital is being reinvested. In short, ROE shows the profit each dollar generates with respect to its shareholder investments.
Check out our latest analysis for STINAG Stuttgart Invest
How Is ROE Calculated?
ROE can be calculated by using the formula:
Return on Equity = Net Profit (from continuing operations) ÷ Shareholders' Equity
So, based on the above formula, the ROE for STINAG Stuttgart Invest is:
3.7% = €5.5m ÷ €148m (Based on the trailing twelve months to June 2023).
The 'return' refers to a company's earnings over the last year. So, this means that for every €1 of its shareholder's investments, the company generates a profit of €0.04.
Does STINAG Stuttgart Invest Have A Good Return On Equity?
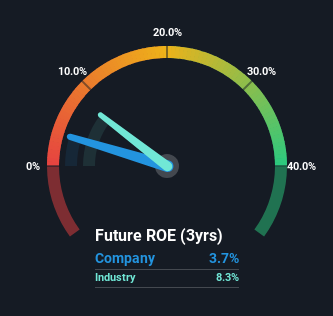
One simple way to determine if a company has a good return on equity is to compare it to the average for its industry. However, this method is only useful as a rough check, because companies do differ quite a bit within the same industry classification. As is clear from the image below, STINAG Stuttgart Invest has a lower ROE than the average (8.3%) in the Real Estate industry.
That's not what we like to see. Although, we think that a lower ROE could still mean that a company has the opportunity to better its returns with the use of leverage, provided its existing debt levels are low. A company with high debt levels and low ROE is a combination we like to avoid given the risk involved. You can see the 2 risks we have identified for STINAG Stuttgart Invest by visiting our risks dashboard for free on our platform here.
How Does Debt Impact ROE?
Most companies need money -- from somewhere -- to grow their profits. That cash can come from issuing shares, retained earnings, or debt. In the first two cases, the ROE will capture this use of capital to grow. In the latter case, the debt required for growth will boost returns, but will not impact the shareholders' equity. That will make the ROE look better than if no debt was used.
STINAG Stuttgart Invest's Debt And Its 3.7% ROE
STINAG Stuttgart Invest clearly uses a high amount of debt to boost returns, as it has a debt to equity ratio of 1.04. With a fairly low ROE, and significant use of debt, it's hard to get excited about this business at the moment. Investors should think carefully about how a company might perform if it was unable to borrow so easily, because credit markets do change over time.
Summary
Return on equity is one way we can compare its business quality of different companies. A company that can achieve a high return on equity without debt could be considered a high quality business. If two companies have around the same level of debt to equity, and one has a higher ROE, I'd generally prefer the one with higher ROE.
But when a business is high quality, the market often bids it up to a price that reflects this. It is important to consider other factors, such as future profit growth -- and how much investment is required going forward. So I think it may be worth checking this free this detailed graph of past earnings, revenue and cash flow.
If you would prefer check out another company -- one with potentially superior financials -- then do not miss this free list of interesting companies, that have HIGH return on equity and low debt.
Have feedback on this article? Concerned about the content? Get in touch with us directly. Alternatively, email editorial-team (at) simplywallst.com.
This article by Simply Wall St is general in nature. We provide commentary based on historical data and analyst forecasts only using an unbiased methodology and our articles are not intended to be financial advice. It does not constitute a recommendation to buy or sell any stock, and does not take account of your objectives, or your financial situation. We aim to bring you long-term focused analysis driven by fundamental data. Note that our analysis may not factor in the latest price-sensitive company announcements or qualitative material. Simply Wall St has no position in any stocks mentioned.
