
 Yahoo Finance
 Can 21Vianet Group Inc (NASDAQ:VNET) Improve Your Portfolio Returns?

If you own shares in 21Vianet Group Inc (NASDAQ:VNET) then it’s worth thinking about how it contributes to the volatility of your portfolio, overall. In finance, Beta is a measure of volatility. Volatility is considered to be a measure of risk in modern finance theory. Investors may think of volatility as falling into two main categories. The first category is company specific volatility. This can be dealt with by limiting your exposure to any particular stock. The other type, which cannot be diversified away, is the volatility of the entire market. Every stock in the market is exposed to this volatility, which is linked to the fact that stocks prices are correlated in an efficient market.
Some stocks see their prices move in concert with the market. Others tend towards stronger, gentler or unrelated price movements. Beta can be a useful tool to understand how much a stock is influenced by market risk (volatility). However, Warren Buffett said ‘volatility is far from synonymous with risk’ in his 2014 letter to investors. So, while useful, beta is not the only metric to consider. To use beta as an investor, you must first understand that the overall market has a beta of one. A stock with a beta below one is either less volatile than the market, or more volatile but not corellated with the overall market. In comparison a stock with a beta of over one tends to be move in a similar direction to the market in the long term, but with greater changes in price.
View our latest analysis for 21Vianet Group
What we can learn from VNET’s beta value
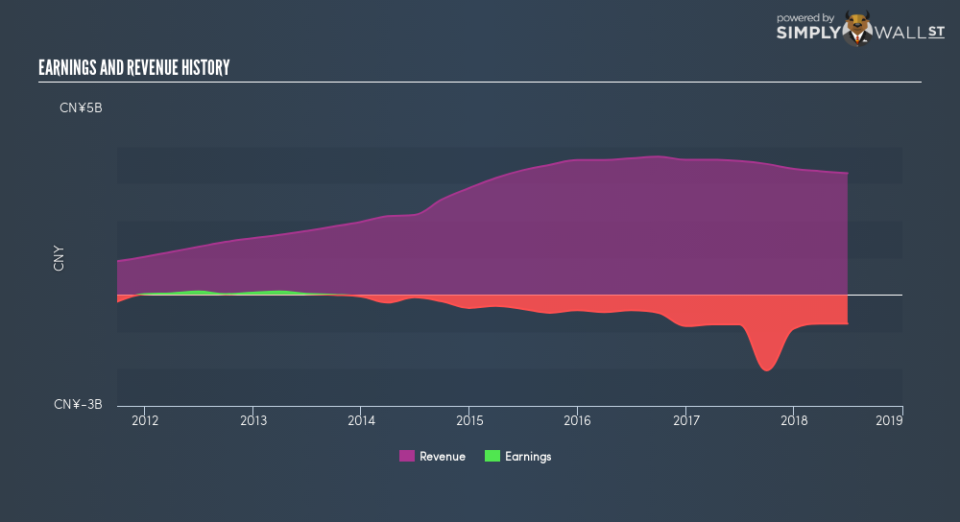
Given that it has a beta of 1.96, we can surmise that the 21Vianet Group share price has been fairly sensitive to market volatility (over the last 5 years). Based on this history, investors should be aware that 21Vianet Group are likely to rise strongly in times of greed, but sell off in times of fear. Many would argue that beta is useful in position sizing, but fundamental metrics such as revenue and earnings are more important overall. You can see 21Vianet Group’s revenue and earnings in the image below.
How does VNET’s size impact its beta?
With a market capitalisation of US$1.04b, 21Vianet Group is a small cap stock. However, it is big enough to catch the attention of professional investors. It’s not particularly surprising that it has a higher beta than the overall market. That’s because it takes less money to influence the share price of a smaller company, than a bigger company.
What this means for you:
Since 21Vianet Group tends to moves up when the market is going up, and down when it’s going down, potential investors may wish to reflect on the overall market, when considering the stock. This article aims to educate investors about beta values, but it’s well worth looking at important company-specific fundamentals such as 21Vianet Group’s financial health and performance track record. I urge you to continue your research by taking a look at the following:
Financial Health: Are VNET’s operations financially sustainable? Balance sheets can be hard to analyze, which is why we’ve done it for you. Check out our financial health checks here.
Past Track Record: Has VNET been consistently performing well irrespective of the ups and downs in the market? Go into more detail in the past performance analysis and take a look at the free visual representations of VNET’s historicals for more clarity.
Other High-Performing Stocks: Are there other stocks that provide better prospects with proven track records? Explore our free list of these great stocks here.
To help readers see past the short term volatility of the financial market, we aim to bring you a long-term focused research analysis purely driven by fundamental data. Note that our analysis does not factor in the latest price-sensitive company announcements.
The author is an independent contributor and at the time of publication had no position in the stocks mentioned. For errors that warrant correction please contact the editor at editorial-team@simplywallst.com.
