
 Yahoo Finance
 With A -21.99% Earnings Drop, Did AVEVA Group plc Prior to Reverse Merger with Schneider Electric Software Business (LON:AVV) Really Underperform?

Examining AVEVA Group plc Prior to Reverse Merger with Schneider Electric Software Business’s (LSE:AVV) past track record of performance is a valuable exercise for investors. It enables us to understand whether the company has met or exceed expectations, which is a powerful signal for future performance. Below, I will assess AVV’s latest performance announced on 30 September 2017 and weigh these figures against its longer term trend and industry movements. See our latest analysis for AVEVA Group Prior to Reverse Merger with Schneider Electric Software Business
How Did AVV’s Recent Performance Stack Up Against Its Past?
I like to use data from the most recent 12 months, which annualizes the latest 6-month earnings release, or some times, the latest annual report is already the most recent financial data. This method enables me to examine different stocks in a uniform manner using the most relevant data points. For AVEVA Group Prior to Reverse Merger with Schneider Electric Software Business, its most recent bottom-line (trailing twelve month) is UK£21.19M, which, relative to the previous year’s level, has dropped by -21.99%. Since these values are fairly myopic, I have created an annualized five-year value for AVEVA Group Prior to Reverse Merger with Schneider Electric Software Business’s earnings, which stands at UK£37.00M This doesn’t seem to paint a better picture, as earnings seem to have consistently been falling over time.
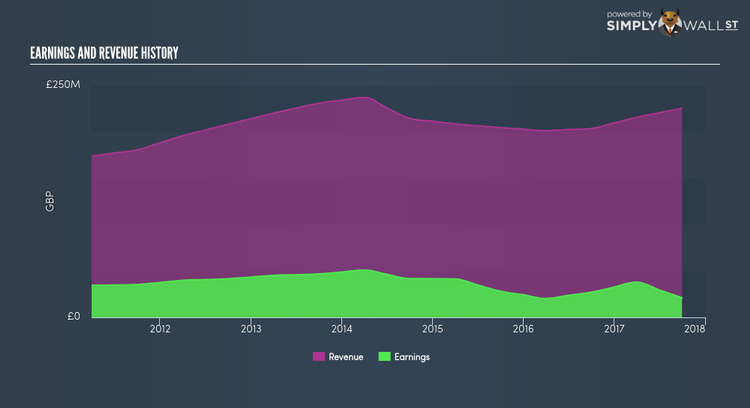
What could be happening here? Well, let’s take a look at what’s going on with margins and whether the rest of the industry is experiencing the hit as well. Revenue growth over the past couple of years, has been positive, however earnings growth has been declining. This means AVEVA Group Prior to Reverse Merger with Schneider Electric Software Business has been ramping up expenses, which is harming margins and earnings, and is not a sustainable practice. Inspecting growth from a sector-level, the UK software industry has been growing its average earnings by double-digit 22.04% in the past twelve months, and 15.27% over the past five years. This means that any tailwind the industry is enjoying, AVEVA Group Prior to Reverse Merger with Schneider Electric Software Business has not been able to realize the gains unlike its industry peers.
What does this mean?
While past data is useful, it doesn’t tell the whole story. In some cases, companies that experience a prolonged period of diminishing earnings are going through some sort of reinvestment phase in order to keep up with the latest industry disruption and expansion. You should continue to research AVEVA Group Prior to Reverse Merger with Schneider Electric Software Business to get a better picture of the stock by looking at:
Future Outlook: What are well-informed industry analysts predicting for AVV’s future growth? Take a look at our free research report of analyst consensus for AVV’s outlook.
Financial Health: Is AVV’s operations financially sustainable? Balance sheets can be hard to analyze, which is why we’ve done it for you. Check out our financial health checks here.
Other High-Performing Stocks: Are there other stocks that provide better prospects with proven track records? Explore our free list of these great stocks here.
NB: Figures in this article are calculated using data from the trailing twelve months from 30 September 2017. This may not be consistent with full year annual report figures.
To help readers see pass the short term volatility of the financial market, we aim to bring you a long-term focused research analysis purely driven by fundamental data. Note that our analysis does not factor in the latest price sensitive company announcements.
The author is an independent contributor and at the time of publication had no position in the stocks mentioned.
