
 Yahoo Finance
 20 Cities Earning the Most Money for Real Estate Investors

Many financial experts recommend investing in real estate, which can help hedge against inflation and bring diversity to your portfolio. But, like all investments, real estate has certain risks. One of the most dire possibilities is that you invest in a location that is seeing property depreciate in value.
Find Out: The Best US Lake Towns To Buy Property in the Next 5 Years, According to Real Estate Agents
Try This: How To Get Rich in Real Estate Starting With Just $1,000
Ideally, you’ll invest in a city where the housing market is booming and showing stability for long-term growth. In a new study, GOBankingRates analyzed cities across the U.S. to find the spots where real estate investors are earning the most money. These are the top 20, in order from the cities earning the least to the most in real estate investments.
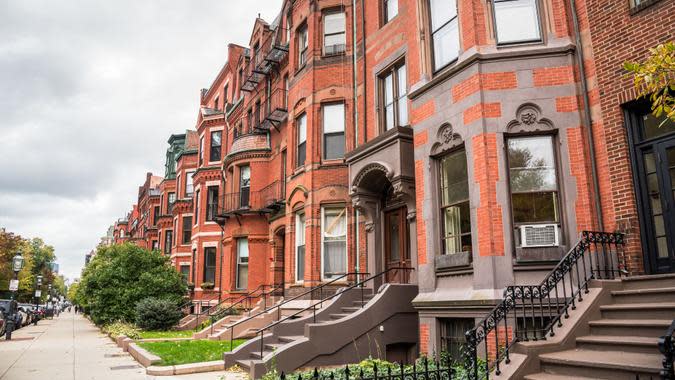
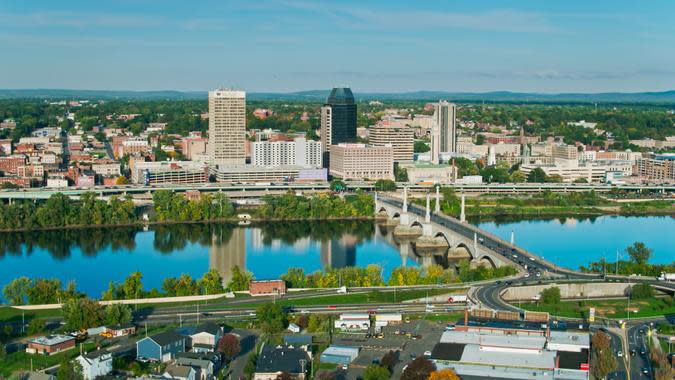
Worcester, Massachusetts
Average single family home price: $435,133
Percentage of homes sold above list price: 63.4%
Share of listings with price cut: 18.3%
Home value forecast change for November 2024: 0.6%
Home value forecast change for August 2025: 2.5%
For You: 8 Places Where Houses Are Suddenly Major Bargains
Explore More: 4 Best International Cities to Buy a House in the Next 5 Years, According to Real Estate Experts
Trending Now: Boomers Hold Half of U.S. Wealth--So Why Are Thousands Living Without Homes?
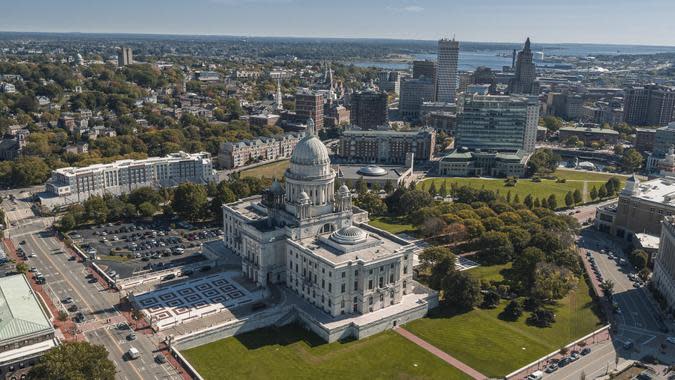
Providence, Rhode Island
Average single family home price: $402,504
Percentage of homes sold above list price: 62.2%
Share of listings with price cut: 17.4%
Home value forecast change for November 2024: 0.8%
Home value forecast change for August 2025: 2.9%
Be Aware: 7 Worst States To Buy Property in the Next 5 Years, According to Real Estate Agents
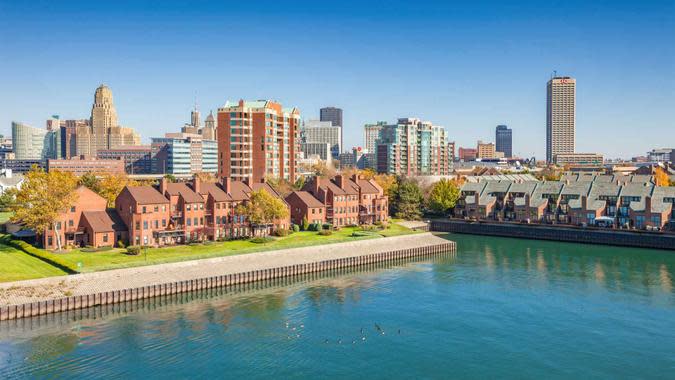
Buffalo, New York
Average single family home price: $232,475
Percentage of homes sold above list price: 70.8%
Share of listings with price cut: 16.9%
Home value forecast change for November 2024: 0.0%
Home value forecast change for August 2025: 1.7%
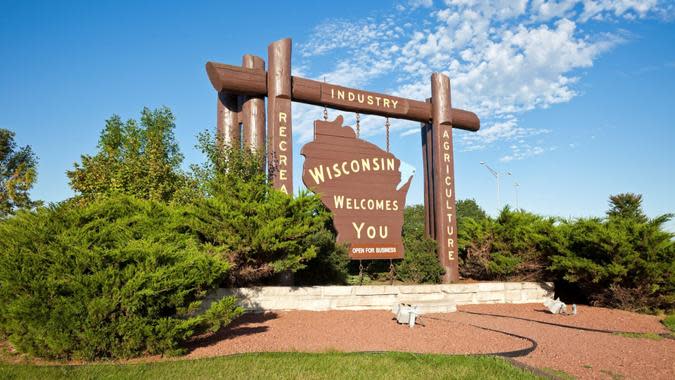
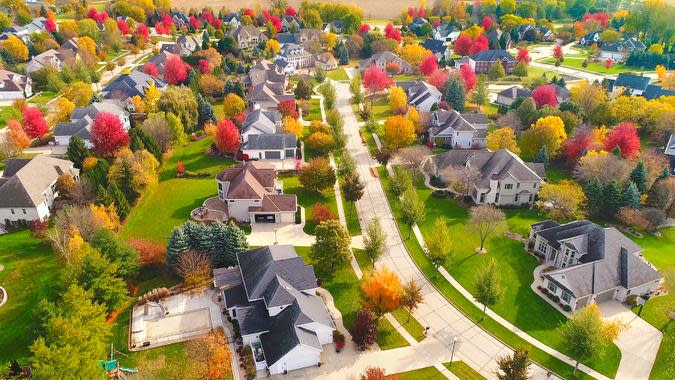
Beaver Dam, Wisconsin
Average single family home price: $259,536
Percentage of homes sold above list price: 55.6%
Share of listings with price cut: 12.4%
Home value forecast change for November 2024: 0.3%
Home value forecast change for August 2025: 1.6%

Madison, Wisconsin
Average single family home price: $426,563
Percentage of homes sold above list price: 67.4%
Share of listings with price cut: 14.1%
Home value forecast change for November 2024: -0.3%
Home value forecast change for August 2025: 0.7%

Bridgeport, Connecticut
Average single family home price: $364,629
Percentage of homes sold above list price: 63.4%
Share of listings with price cut: 14.8%
Home value forecast change for November 2024: 0.2%
Home value forecast change for August 2025: 1.9%
Read Next: 3 Best States To Buy Property in the Next 5 Years, According to Experts
Springfield, Massachusetts
Average single family home price: $287,106
Percentage of homes sold above list price: 66.9%
Share of listings with price cut: 16.0%
Home value forecast change for November 2024: 0.4%
Home value forecast change for August 2025: 1.8%

Janesville, Wisconsin
Average single family home price: $269,104
Percentage of homes sold above list price: 56.7%
Share of listings with price cut: 11.9%
Home value forecast change for November 2024: 0.2%
Home value forecast change for August 2025: 1.9%
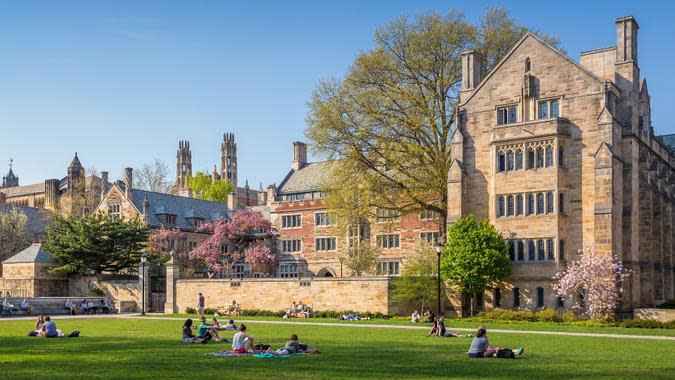
New Haven, Connecticut
Average single family home price: $325,033
Percentage of homes sold above list price: 66.9%
Share of listings with price cut: 17.9%
Home value forecast change for November 2024: 0.8%
Home value forecast change for August 2025: 3.5%

Oshkosh, Wisconsin
Average single family home price: $233,015
Percentage of homes sold above list price: 58.2%
Share of listings with price cut: 10.0%
Home value forecast change for November 2024: -0.2%
Home value forecast change for August 2025: 0.9%
Discover More: 20 Best Cities Where You Can Buy a House for Under $100K
Green Bay, Wisconsin
Average single family home price: $255,883
Percentage of homes sold above list price: 62.7%
Share of listings with price cut: 12.6%
Home value forecast change for November 2024: 0.1%
Home value forecast change for August 2025: 2.0%
Norwich, Connecticut
Average single family home price: $276,488
Percentage of homes sold above list price: 61.4%
Share of listings with price cut: 14.8%
Home value forecast change for November 2024: 0.8%
Home value forecast change for August 2025: 3.2%

San Jose, California
Average single family home price: $1,509,775
Percentage of homes sold above list price: 74.4%
Share of listings with price cut: 15.8%
Home value forecast change for November 2024: 0.5%
Home value forecast change for August 2025: 0.4%

Syracuse, New York
Average single family home price: $195,362
Percentage of homes sold above list price: 70.4%
Share of listings with price cut: 15.2%
Home value forecast change for November 2024: 0.4%
Home value forecast change for August 2025: 3.0%
Consider This: 5 Types of Homes That Will Plummet in Value in 2024
Appleton, Wisconsin
Average single family home price: $272,935
Percentage of homes sold above list price: 64.8%
Share of listings with price cut: 9.3%
Home value forecast change for November 2024: 0.2%
Home value forecast change for August 2025: 1.7%
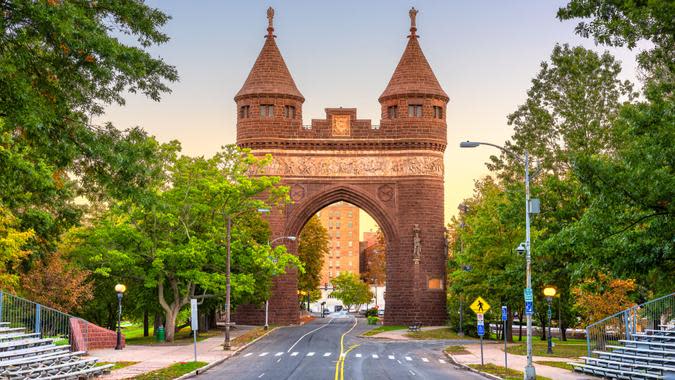
Hartford, Connecticut
Average single family home price: $244,896
Percentage of homes sold above list price: 73.3%
Share of listings with price cut: 14.4%
Home value forecast change for November 2024: 0.7%
Home value forecast change for August 2025: 3.0%
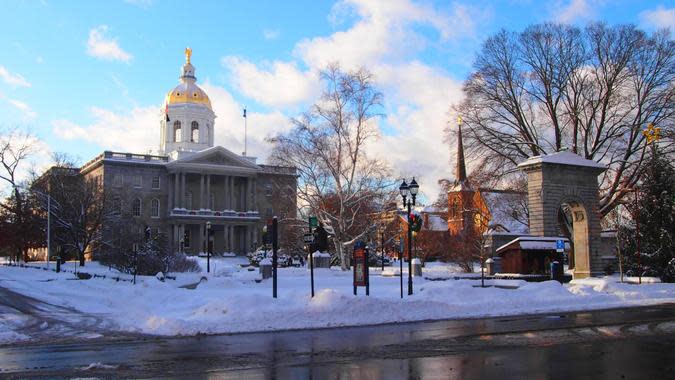
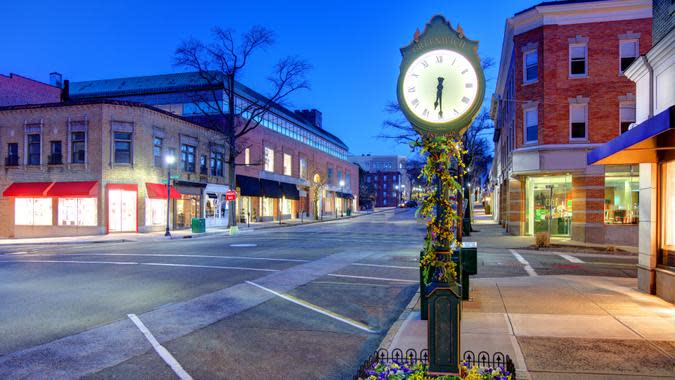
Concord, New Hampshire
Average single family home price: $451,825
Percentage of homes sold above list price: 74.6%
Share of listings with price cut: 15.8%
Home value forecast change for November 2024: 0.9%
Home value forecast change for August 2025: 4.3%

Manchester, New Hampshire
Average single family home price: $440,686
Percentage of homes sold above list price: 76.7%
Share of listings with price cut: 14.4%
Home value forecast change for November 2024: 0.6%
Home value forecast change for August 2025: 3.5%
Trending Now: 5 Cities Where Homes Will Be a Total Steal In Two Years
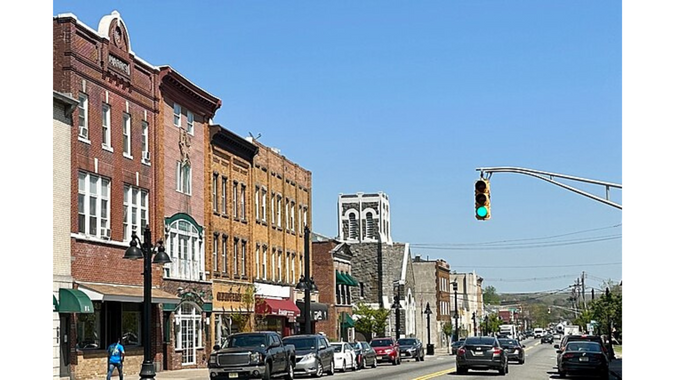
Trenton, New Jersey
Average single family home price: $335,069
Percentage of homes sold above list price: 72.1%
Share of listings with price cut: 11.7%
Home value forecast change for November 2024: 0.7%
Home value forecast change for August 2025: 2.9%

Rochester, New York
Average single family home price: $224,541
Percentage of homes sold above list price: 82.1%
Share of listings with price cut: 10.8%
Home value forecast change for November 2024: 0.0%
Home value forecast change for August 2025: 2.6%
Methodology: For this study, GOBankingRates analyzed cities to find the places where real estate investors are earning the most money. Using Zillow research data, locations with housing data were recorded. For each location, a number of factors were found, including: total population, population ages 65 and over, total households and household median income, all sourced from the U.S. Census American Community Survey. Using this data, the percentage of the population ages 65 and over can be calculated. The cost-of-living indexes were sourced from Sperling’s BestPlaces and include the grocery, healthcare, housing, utilities, transportation and miscellaneous cost-of-living indexes. Using the cost-of-living indexes and the national average expenditure costs, as sourced from the Bureau of Labor Statistics Consumer Expenditure Survey, the expenditure cost for each location can be calculated. The average single family home value was sourced from the Zillow Home Value Index for September 2024. Using the average single family home value, assuming a 10% down payment, and using the national average 30 year fixed mortgage rate, as sourced from the Federal Reserve Economic Data, the average mortgage can be calculated. The average expenditure and mortgage costs were used to find a total cost of living for each location. The estimated future home value for November 2024 and August 2025 were both sourced from the Zillow Home Value Forecast. Shares of listing with price cuts, the median percentage price cut from listing prices, the percent of homes sold above listings, and percentage of homes sold below listings were all sourced from Zillow research data. The percentage of homes sold above listing price was scored and weighted at 1.00, the listings with price cuts percentage was scored and weighted at 1.00, the home forecast for November 2024 was scored and weighted at 0.50, and the home forecast for August 2025 was scored and weighted at 0.50. All the scores were summed and sorted to show the places where real estate investors will earn the most. All data was collected on and is up to date as of Oct. 4, 2024.
Photo Disclaimer: Please note photos are for representational purposes only. As a result, some of the photos might not reflect the locations listed in this article.
More From GOBankingRates
9 Moves For Building Lasting Wealth: What Smart Americans Are Doing Right
10 Kirkland Clothing Products You Should Buy in October to Maximize Savings
This article originally appeared on GOBankingRates.com: 20 Cities Earning the Most Money for Real Estate Investors
