
 Yahoo Finance
 With A 11% Return On Equity, Is Source Energy Services Ltd. (TSE:SHLE) A Quality Stock?
Many investors are still learning about the various metrics that can be useful when analysing a stock. This article is for those who would like to learn about Return On Equity (ROE). We'll use ROE to examine Source Energy Services Ltd. (TSE:SHLE), by way of a worked example.
Return on Equity or ROE is a test of how effectively a company is growing its value and managing investors’ money. Simply put, it is used to assess the profitability of a company in relation to its equity capital.
View our latest analysis for Source Energy Services
How Is ROE Calculated?
ROE can be calculated by using the formula:
Return on Equity = Net Profit (from continuing operations) ÷ Shareholders' Equity
So, based on the above formula, the ROE for Source Energy Services is:
11% = CA$2.1m ÷ CA$19m (Based on the trailing twelve months to September 2023).
The 'return' is the yearly profit. That means that for every CA$1 worth of shareholders' equity, the company generated CA$0.11 in profit.
Does Source Energy Services Have A Good Return On Equity?
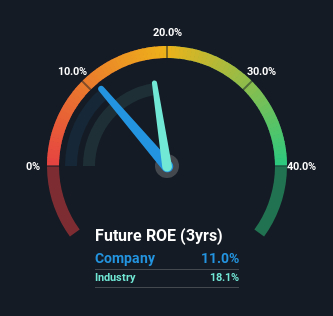
Arguably the easiest way to assess company's ROE is to compare it with the average in its industry. However, this method is only useful as a rough check, because companies do differ quite a bit within the same industry classification. As shown in the graphic below, Source Energy Services has a lower ROE than the average (18%) in the Energy Services industry classification.
That's not what we like to see. However, a low ROE is not always bad. If the company's debt levels are moderate to low, then there's still a chance that returns can be improved via the use of financial leverage. A high debt company having a low ROE is a different story altogether and a risky investment in our books. To know the 3 risks we have identified for Source Energy Services visit our risks dashboard for free.
How Does Debt Impact ROE?
Most companies need money -- from somewhere -- to grow their profits. The cash for investment can come from prior year profits (retained earnings), issuing new shares, or borrowing. In the first and second cases, the ROE will reflect this use of cash for investment in the business. In the latter case, the debt required for growth will boost returns, but will not impact the shareholders' equity. That will make the ROE look better than if no debt was used.
Source Energy Services' Debt And Its 11% ROE
It appears that Source Energy Services makes extensive use of debt to improve its returns, because it has an alarmingly high debt to equity ratio of 8.53. Most investors would need a low share price to be interested in a company with low ROE and high debt to equity.
Conclusion
Return on equity is one way we can compare its business quality of different companies. In our books, the highest quality companies have high return on equity, despite low debt. All else being equal, a higher ROE is better.
But ROE is just one piece of a bigger puzzle, since high quality businesses often trade on high multiples of earnings. The rate at which profits are likely to grow, relative to the expectations of profit growth reflected in the current price, must be considered, too. So you might want to check this FREE visualization of analyst forecasts for the company.
If you would prefer check out another company -- one with potentially superior financials -- then do not miss this free list of interesting companies, that have HIGH return on equity and low debt.
Have feedback on this article? Concerned about the content? Get in touch with us directly. Alternatively, email editorial-team (at) simplywallst.com.
This article by Simply Wall St is general in nature. We provide commentary based on historical data and analyst forecasts only using an unbiased methodology and our articles are not intended to be financial advice. It does not constitute a recommendation to buy or sell any stock, and does not take account of your objectives, or your financial situation. We aim to bring you long-term focused analysis driven by fundamental data. Note that our analysis may not factor in the latest price-sensitive company announcements or qualitative material. Simply Wall St has no position in any stocks mentioned.
