
 Yahoo Finance
 With A 10% Return On Equity, Is Arko Corp. (NASDAQ:ARKO) A Quality Stock?
Many investors are still learning about the various metrics that can be useful when analysing a stock. This article is for those who would like to learn about Return On Equity (ROE). To keep the lesson grounded in practicality, we'll use ROE to better understand Arko Corp. (NASDAQ:ARKO).
Return on equity or ROE is a key measure used to assess how efficiently a company's management is utilizing the company's capital. In short, ROE shows the profit each dollar generates with respect to its shareholder investments.
View our latest analysis for Arko
How Is ROE Calculated?
ROE can be calculated by using the formula:
Return on Equity = Net Profit (from continuing operations) ÷ Shareholders' Equity
So, based on the above formula, the ROE for Arko is:
10% = US$36m ÷ US$361m (Based on the trailing twelve months to March 2024).
The 'return' is the amount earned after tax over the last twelve months. One way to conceptualize this is that for each $1 of shareholders' capital it has, the company made $0.10 in profit.
Does Arko Have A Good Return On Equity?
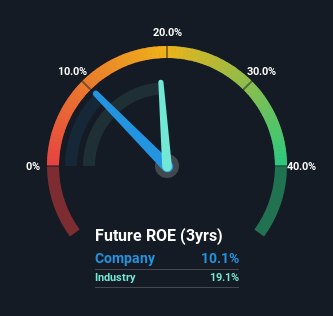
Arguably the easiest way to assess company's ROE is to compare it with the average in its industry. The limitation of this approach is that some companies are quite different from others, even within the same industry classification. If you look at the image below, you can see Arko has a lower ROE than the average (19%) in the Specialty Retail industry classification.
Unfortunately, that's sub-optimal. That being said, a low ROE is not always a bad thing, especially if the company has low leverage as this still leaves room for improvement if the company were to take on more debt. A company with high debt levels and low ROE is a combination we like to avoid given the risk involved. To know the 4 risks we have identified for Arko visit our risks dashboard for free.
How Does Debt Impact Return On Equity?
Companies usually need to invest money to grow their profits. That cash can come from retained earnings, issuing new shares (equity), or debt. In the first and second cases, the ROE will reflect this use of cash for investment in the business. In the latter case, the debt used for growth will improve returns, but won't affect the total equity. That will make the ROE look better than if no debt was used.
Arko's Debt And Its 10% ROE
Arko clearly uses a high amount of debt to boost returns, as it has a debt to equity ratio of 2.45. The combination of a rather low ROE and significant use of debt is not particularly appealing. Investors should think carefully about how a company might perform if it was unable to borrow so easily, because credit markets do change over time.
Conclusion
Return on equity is useful for comparing the quality of different businesses. Companies that can achieve high returns on equity without too much debt are generally of good quality. All else being equal, a higher ROE is better.
Having said that, while ROE is a useful indicator of business quality, you'll have to look at a whole range of factors to determine the right price to buy a stock. The rate at which profits are likely to grow, relative to the expectations of profit growth reflected in the current price, must be considered, too. So I think it may be worth checking this free report on analyst forecasts for the company.
Of course, you might find a fantastic investment by looking elsewhere. So take a peek at this free list of interesting companies.
Have feedback on this article? Concerned about the content? Get in touch with us directly. Alternatively, email editorial-team (at) simplywallst.com.
This article by Simply Wall St is general in nature. We provide commentary based on historical data and analyst forecasts only using an unbiased methodology and our articles are not intended to be financial advice. It does not constitute a recommendation to buy or sell any stock, and does not take account of your objectives, or your financial situation. We aim to bring you long-term focused analysis driven by fundamental data. Note that our analysis may not factor in the latest price-sensitive company announcements or qualitative material. Simply Wall St has no position in any stocks mentioned.
