
 Yahoo Finance
 With A 0.7% Return On Equity, Is Eastfield Resources Ltd. (CVE:ETF) A Quality Stock?

Many investors are still learning about the various metrics that can be useful when analysing a stock. This article is for those who would like to learn about Return On Equity (ROE). By way of learning-by-doing, we’ll look at ROE to gain a better understanding of Eastfield Resources Ltd. (CVE:ETF).
Our data shows Eastfield Resources has a return on equity of 0.7% for the last year. One way to conceptualize this, is that for each CA$1 of shareholders’ equity it has, the company made CA$0.0066 in profit.
See our latest analysis for Eastfield Resources
How Do You Calculate ROE?
The formula for ROE is:
Return on Equity = Net Profit ÷ Shareholders’ Equity
Or for Eastfield Resources:
0.7% = 0.015709 ÷ CA$2.4m (Based on the trailing twelve months to November 2018.)
Most know that net profit is the total earnings after all expenses, but the concept of shareholders’ equity is a little more complicated. It is all the money paid into the company from shareholders, plus any earnings retained. The easiest way to calculate shareholders’ equity is to subtract the company’s total liabilities from the total assets.
What Does Return On Equity Signify?
ROE measures a company’s profitability against the profit it retains, and any outside investments. The ‘return’ is the amount earned after tax over the last twelve months. That means that the higher the ROE, the more profitable the company is. So, all else being equal, a high ROE is better than a low one. That means it can be interesting to compare the ROE of different companies.
Does Eastfield Resources Have A Good ROE?
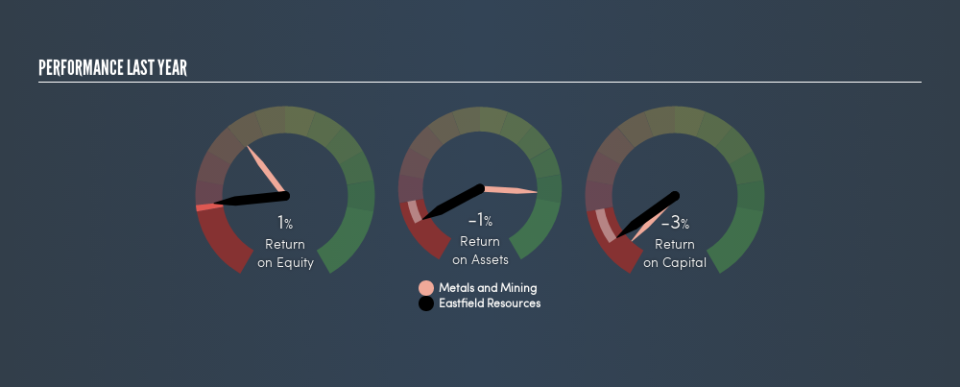
Arguably the easiest way to assess company’s ROE is to compare it with the average in its industry. Importantly, this is far from a perfect measure, because companies differ significantly within the same industry classification. As is clear from the image below, Eastfield Resources has a lower ROE than the average (10%) in the Metals and Mining industry.
That’s not what we like to see. It is better when the ROE is above industry average, but a low one doesn’t necessarily mean the business is overpriced. Nonetheless, it might be wise to check if insiders have been selling.
How Does Debt Impact Return On Equity?
Most companies need money — from somewhere — to grow their profits. That cash can come from issuing shares, retained earnings, or debt. In the first and second cases, the ROE will reflect this use of cash for investment in the business. In the latter case, the use of debt will improve the returns, but will not change the equity. Thus the use of debt can improve ROE, albeit along with extra risk in the case of stormy weather, metaphorically speaking.
Combining Eastfield Resources’s Debt And Its 0.7% Return On Equity
One positive for shareholders is that Eastfield Resources does not have any net debt! So while I find its ROE to be rather low, at least it didn’t use debt. At the end of the day, when a company has zero debt, it is in a better position to take future growth opportunities.
But It’s Just One Metric
Return on equity is one way we can compare the business quality of different companies. A company that can achieve a high return on equity without debt could be considered a high quality business. All else being equal, a higher ROE is better.
But ROE is just one piece of a bigger puzzle, since high quality businesses often trade on high multiples of earnings. The rate at which profits are likely to grow, relative to the expectations of profit growth reflected in the current price, must be considered, too. You can see how the company has grow in the past by looking at this FREE detailed graph of past earnings, revenue and cash flow.
Of course, you might find a fantastic investment by looking elsewhere. So take a peek at this free list of interesting companies.
We aim to bring you long-term focused research analysis driven by fundamental data. Note that our analysis may not factor in the latest price-sensitive company announcements or qualitative material.
If you spot an error that warrants correction, please contact the editor at editorial-team@simplywallst.com. This article by Simply Wall St is general in nature. It does not constitute a recommendation to buy or sell any stock, and does not take account of your objectives, or your financial situation. Simply Wall St has no position in the stocks mentioned. Thank you for reading.
